
Divergence ?? Maybe

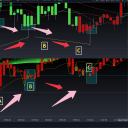
Where Im getting lost at is point B's wick is shorter than that of point C's. but yet its candle is higher than point C on the Algo.
So my mind is getting scrambled from point A candle and wick being the lowest of them all and showing a nice divergence but B and C are throwing me off.
(cant find out how to add image )
Replies


CoffeeShopCrypto
i think you are getting confused because you like many other people are attempting to believe that the wick and price level of a heiken ashi candle...
Show more
2 years ago
CoffeeShopCrypto
Also read my last comment here before you try taking a long just because you see a bullish divergence. You guys keep missing the most important...
Show more
2 years ago
https://www.coffeeshopcrypto.net/index.php/lounge/pages/viewpage/4-how-to-confirm-the-divergence?actid=938
This is the step by step video for this strategy / Idea
This is the step by step video for this strategy / Idea
www.coffeeshopcrypto.net/index.php/lounge/pages/viewpage/4-how-to-confirm-the-divergence?actid=938