CoffeeShopCrypto CoffeeBreak
For me the RSI who's been a very powerful tool but one of the things that's been missing from it time and time again is the ability to show true dynamic support and resistance that is generated by the movements of the RSI.
This version of the Relative Strength Index is designed to visualize and mark Support and Resistance conditions on the Relative Strength Index (RSI) itself, and leaving behind those known dynamic support and resistance (S/R) zones.
It also has the ability during live marks to show you whether the majority of momentum is to the bullish or bearish side and if there is a conflict between the current momentum and the support or resistance zone that you are inside of. In short it will create the zones during live market.
This means you don't have to wait to only look at previous values you can also make an assessment during live breakouts on current support and resistance levels as well as using previous support and resistance levels as markers for any limits in movement.
Leave a comment below to gain access.
Make sure yourprofile already includes yourTradingView Username so that I can help you with this indicator if you need it.
Your access to this indicator is contingent on your agreement to follow the Activity Rule in our FAQ
This Indicator DOES NOT REPAINT
Inputs Tab:
Show Dynamic Zone Creator - Gives you a live action SR Generator on your chart at your current bars which extends a bit into the future for a better visual sense of activity.
The color of this area can be set manually or you can let the script color this area automatically.
This Generator helps to plot Support and Resistance Zones on your chart.
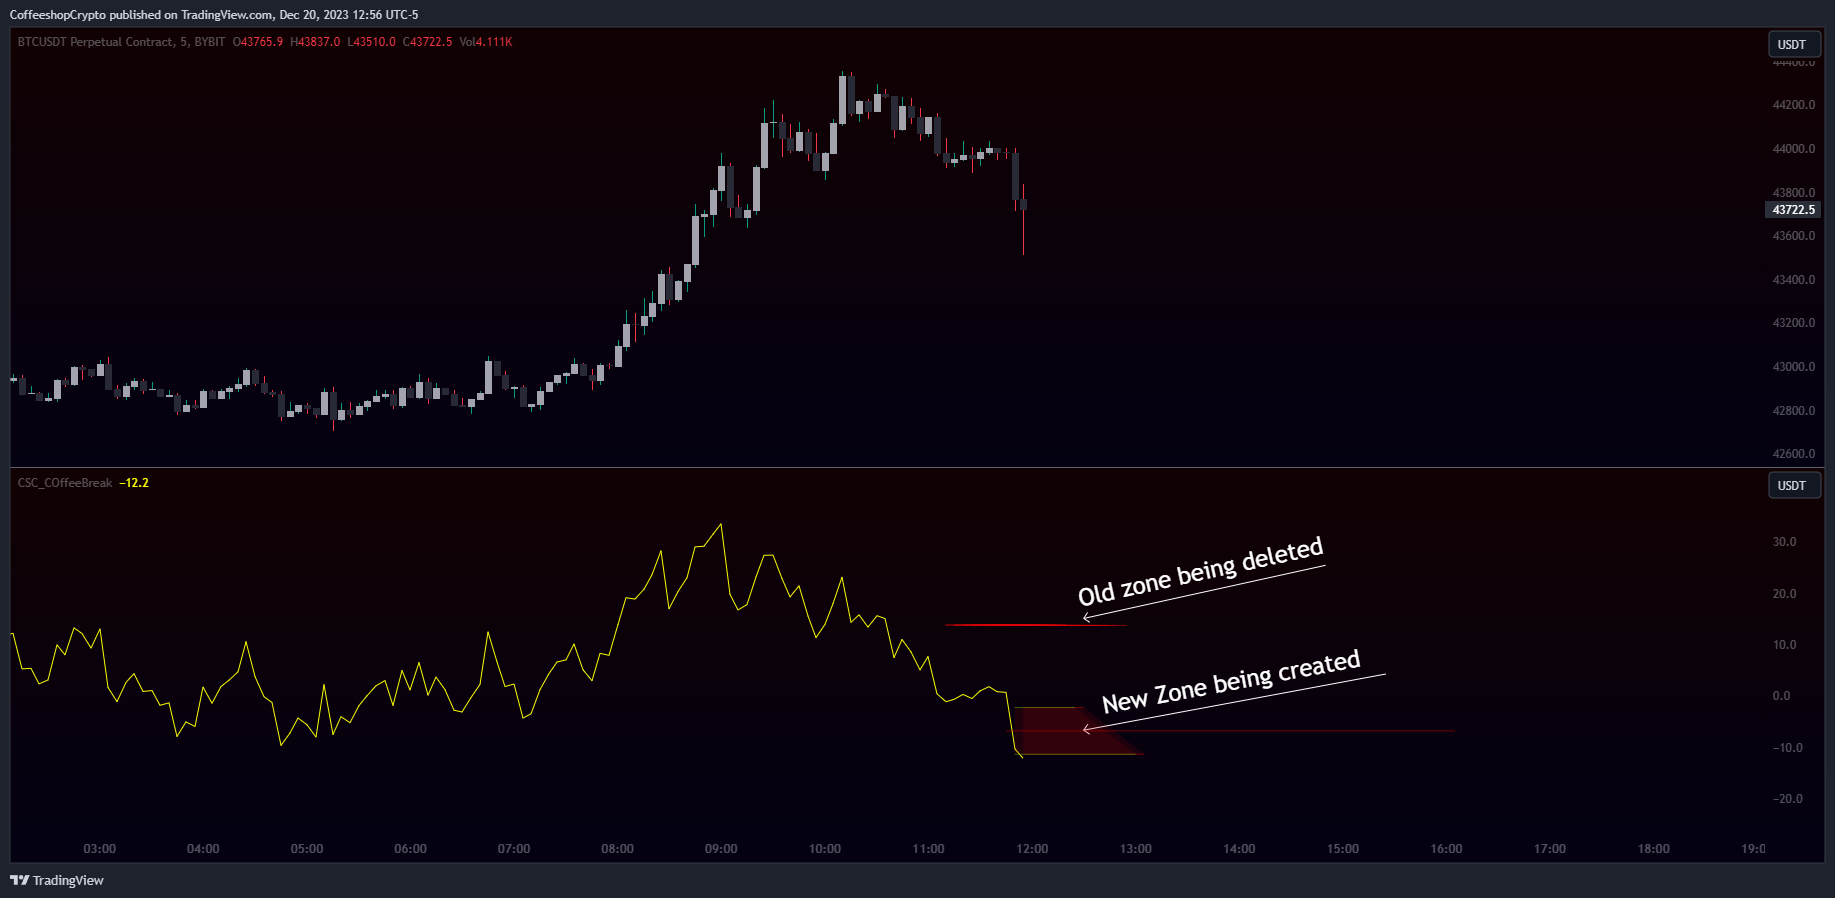
If no zone is triggered then it will move on.
If a zone is triggered, it will change to the appropriate color and leave the zone behind as the new candles form.
Show Dynamic Zone Mid Level - This is just a midline of the Zone Creator to get an earlier visualization of what's happening inside the zone when it is very large.
I use this midline as a breakpoint when price and RSI values come back to this level and both break it. If only ONE breaks the level, I do not take it as a confirmation.
Extend RSI support and resistance boxes into the future - this is strictly up to the user which value you set. It will simply extend the zones that were left behind into the future as many bars as you choose. Depending on the chart or asset that you trade and how much volatility there is at the time you should be able to determine a good length for these boxes.
How many bars reflect the dynamic S/R zone - raising this value can overlap more zones using more bars going backwards. This can intensify the color of the current zone being created. The lowest value you should use is 2. But the higher you make this value you will also be able to see previous zones created with more intensity. Raising this value above the RSI value can give you a very nice previous depletion of color on previous zones where you'll be able to watch them fade away and it will intensify the current ones being created.
Only show this many previous support and resistance zones - this is a way to limit the number of zones that are being left behind on your chart which could possibly slow down the activity of calculations and how your chart moves with more indicators on it. Technically you can show 400 to 500 previous zones on your chart but you don't really need to see that many in the past so set this to something that is relative to how far in history you need to reference SR levels.
------------------------------------------------------------------------------------------------------------------------------------------------------------------
-------------Lets talk about how to take trades and see false breakouts.-------------
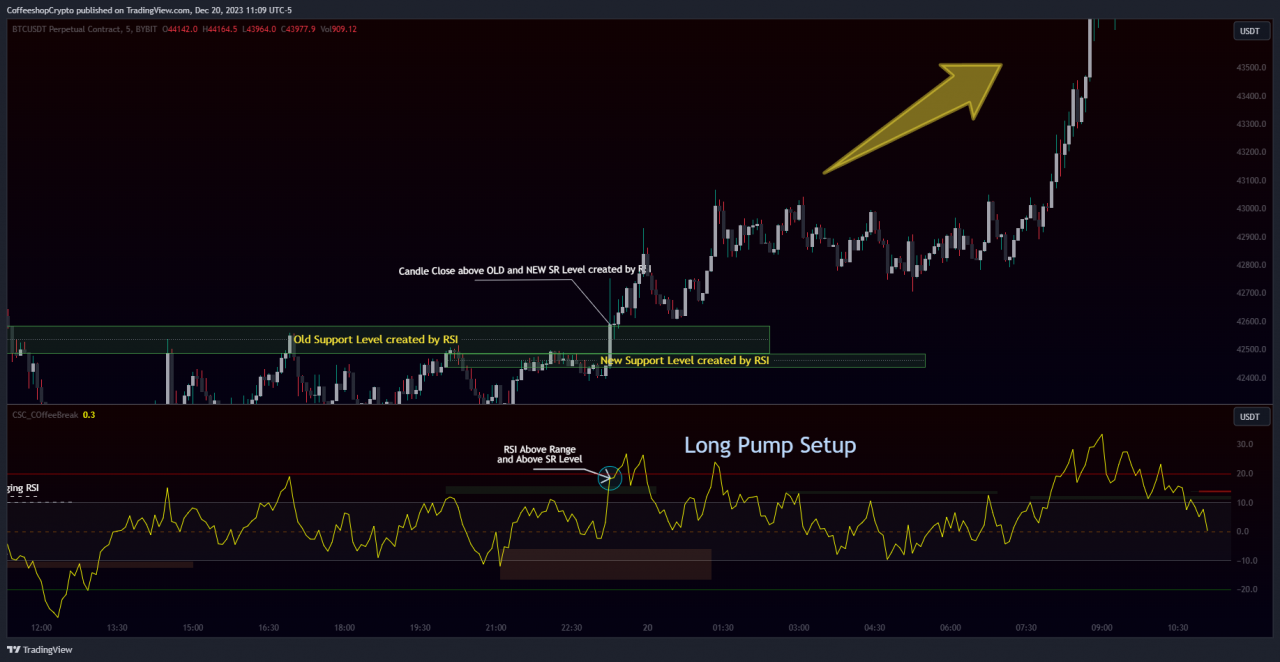
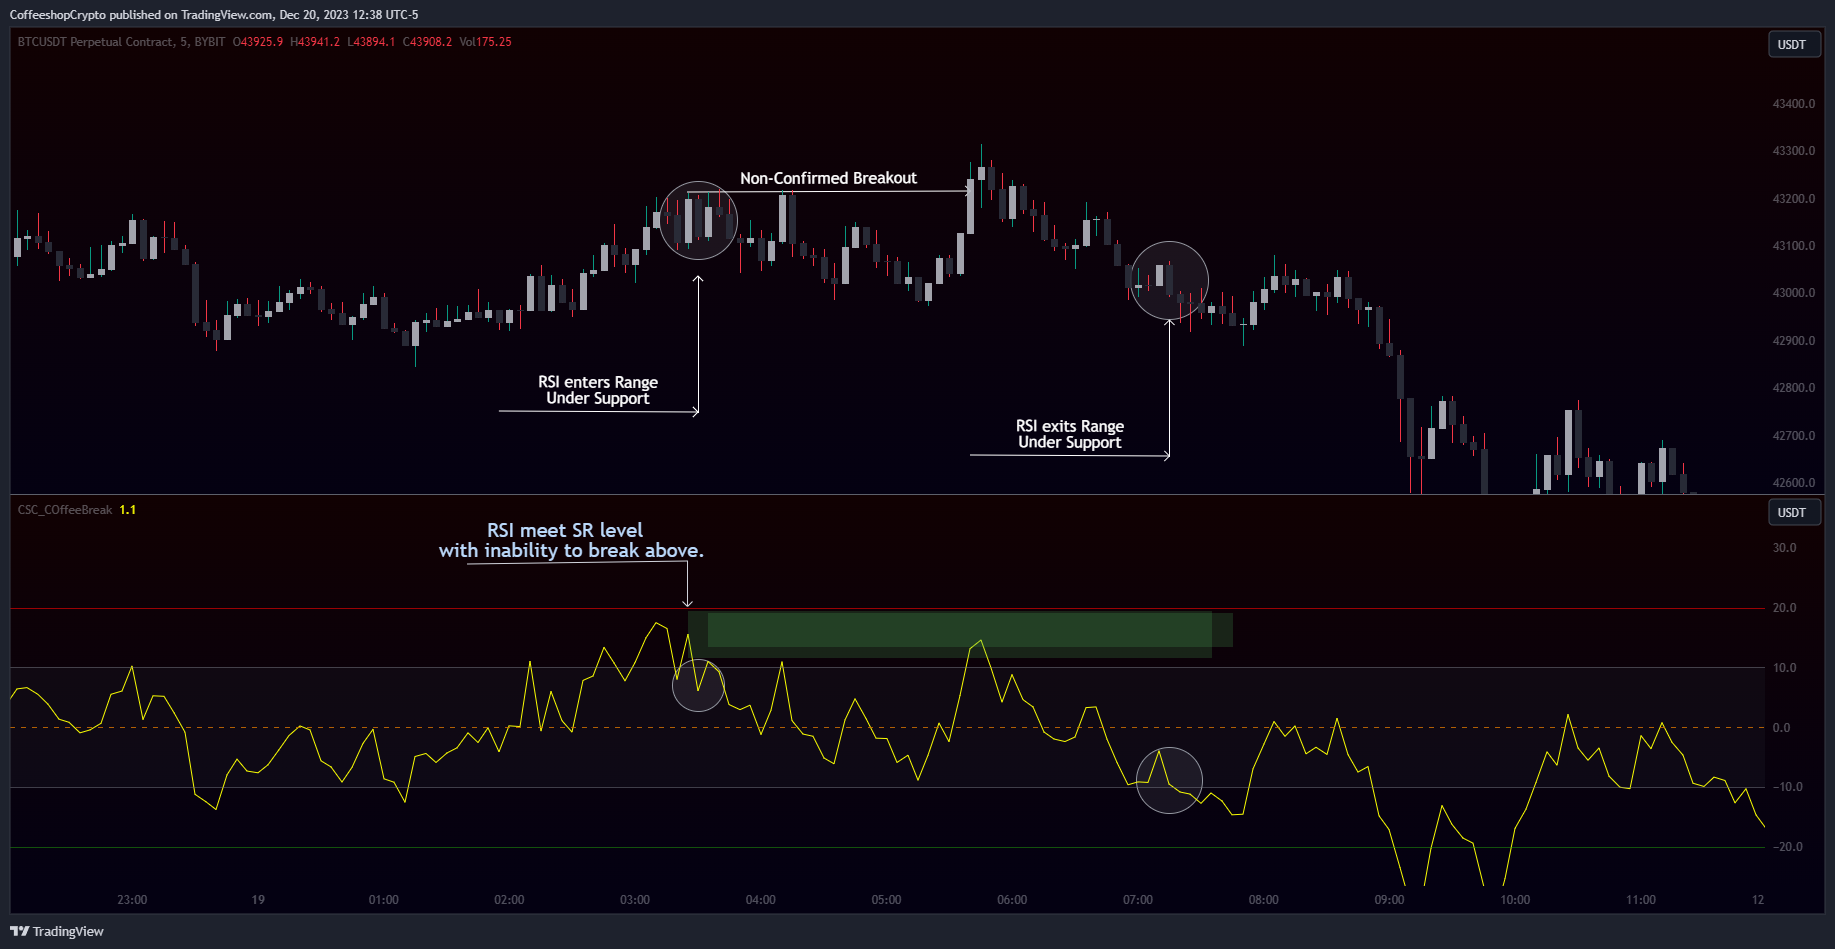
Support Created, Not broken, False Breakout
In the image below you can see how the Dynamic Zone Generator left behind a Support Level however the RSI was unable to break above it.
This creates a price swing on the chart.
The RSI later comes back to this level, however while price breaks this level, the RSI does not.
This confirms that it is a false breakout.
------------------------------------------------------------------------------------------
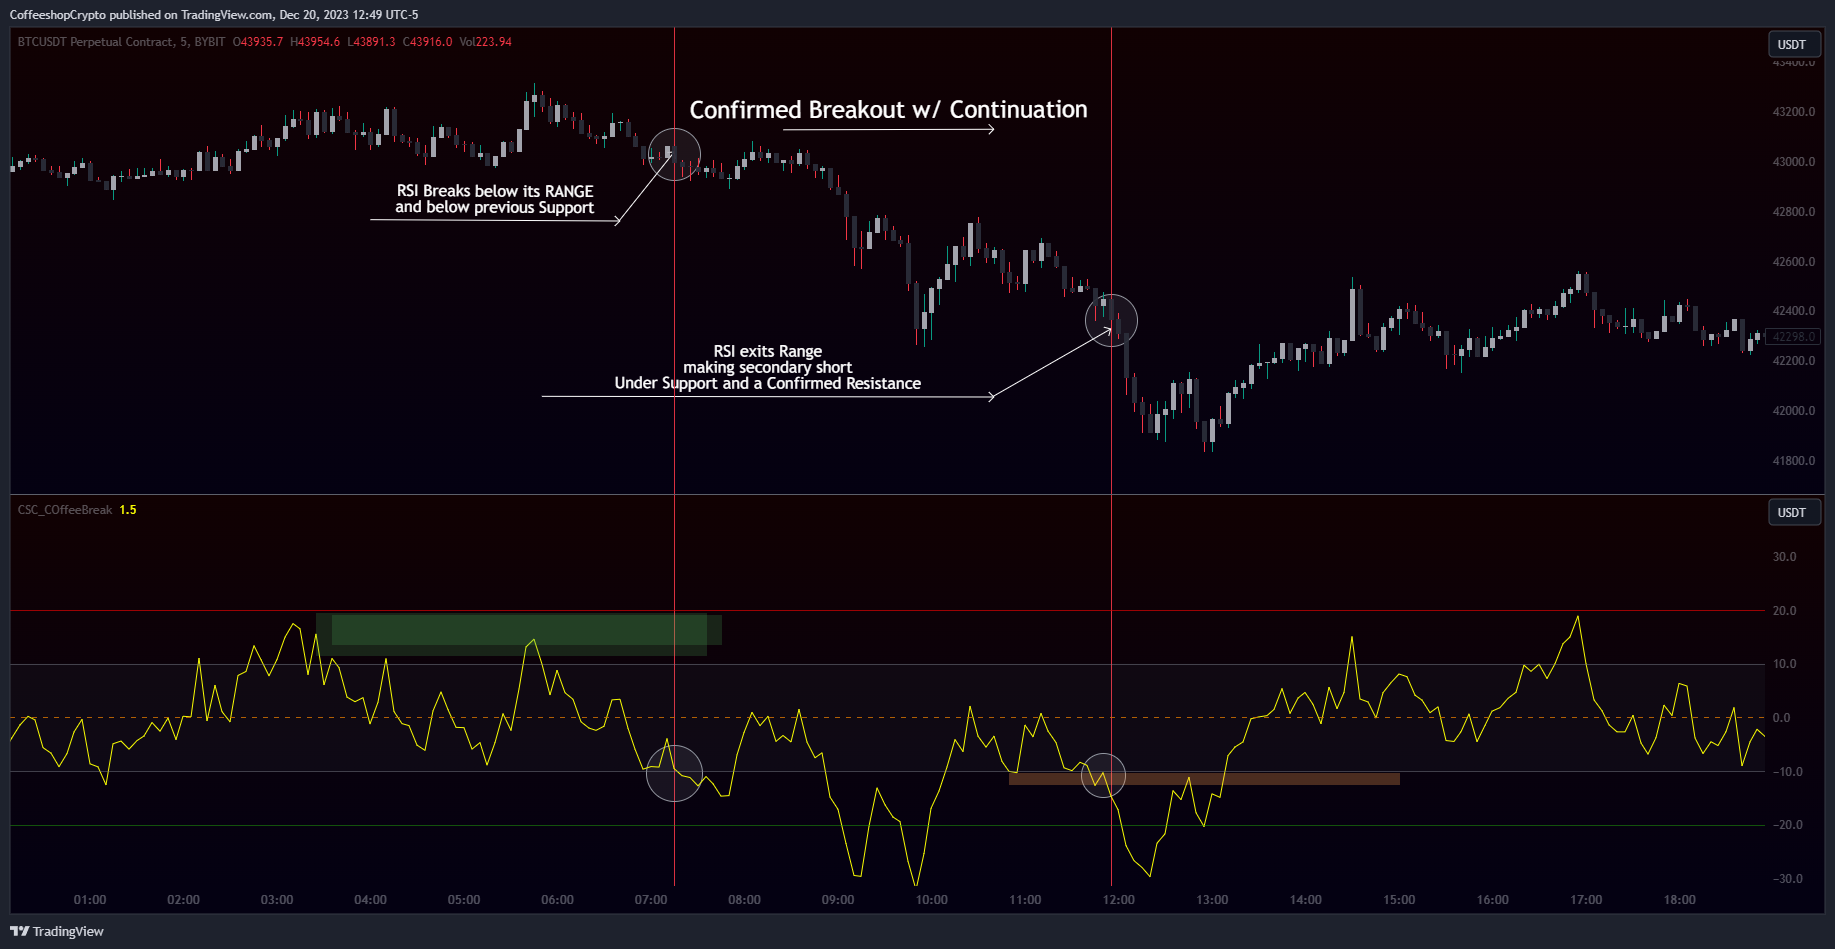
Now lets take a look at what a confirmed breakout is for a short along with a Continuation of short move. This is quickly followed by a divergence.
In the image below you can see how the RSI was in its ranging area and broke below that range. In this case it would be be below -10. During this time it never created a support level or resistance level underneath it implicating that it has continuous movement.
You can see later that when it broke back inside of the range did not go long instead there was a red resistance area created below the RSI. The RSI then again broke below -10 and it broke through this resistance area below it indicating another quick short entry. This is the setup for a quick continuation. Be careful of these setups as they are usually followed quickly by a divergence.
----------------------------------------------------------------------------------
The Dynamic Zone Creator takes its time to calculate. It cant predict the future so you'll have to just let it do its thing. Once the candles close and they confirm, you'll have the color, and zone size you need.
The Dynamic Zone Creator works against your currently OPEN candles.
It will give you a high and a low area of a zone which you can use in later points of the oscillator to determine if you have valid breakouts and or bounces of price and momentum.
When set to automatic coloring, its zone background and midline will automatically change their colors to match the momentum of the RSI and price.
If there is no support or resistance found, the Zone Creator will simply move onto the next candles in play.
If there IS support or resistance found, the Zone Creator will leave behind a phantom zone or Support or Resistance.
Keep in mind these zones left behind will turn into opposing Support or Resistance depending on if price and momentum break these areas simultaneously.
New Feature Added
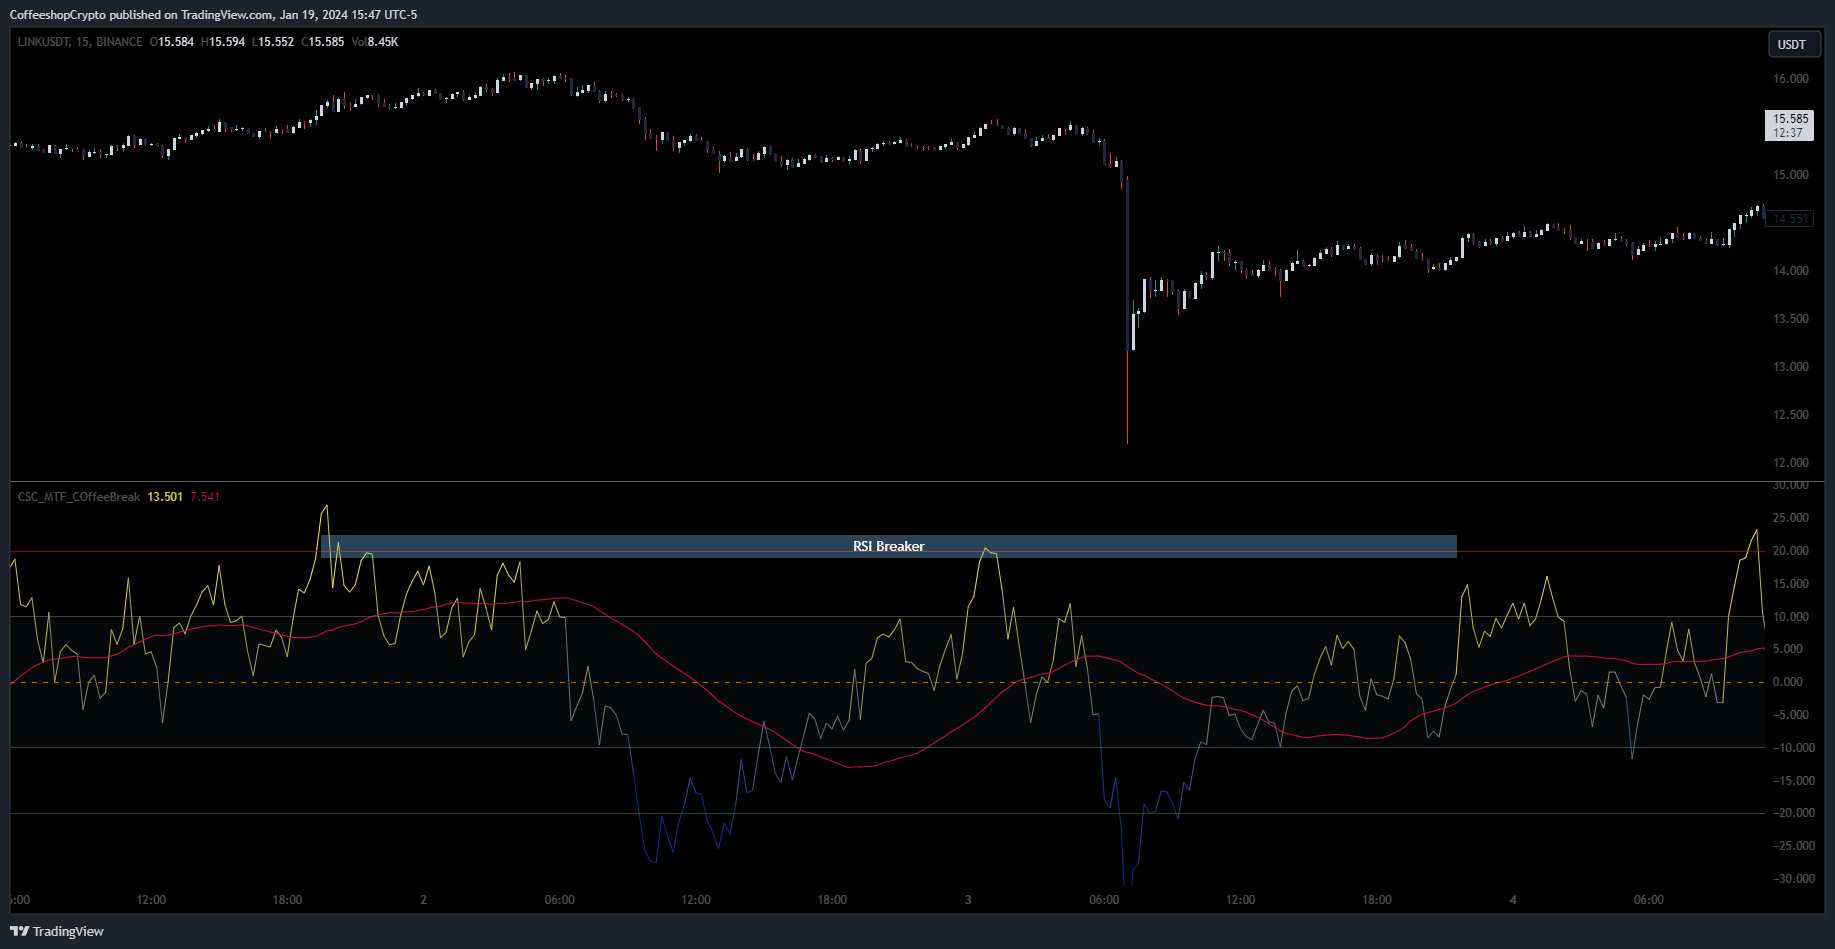
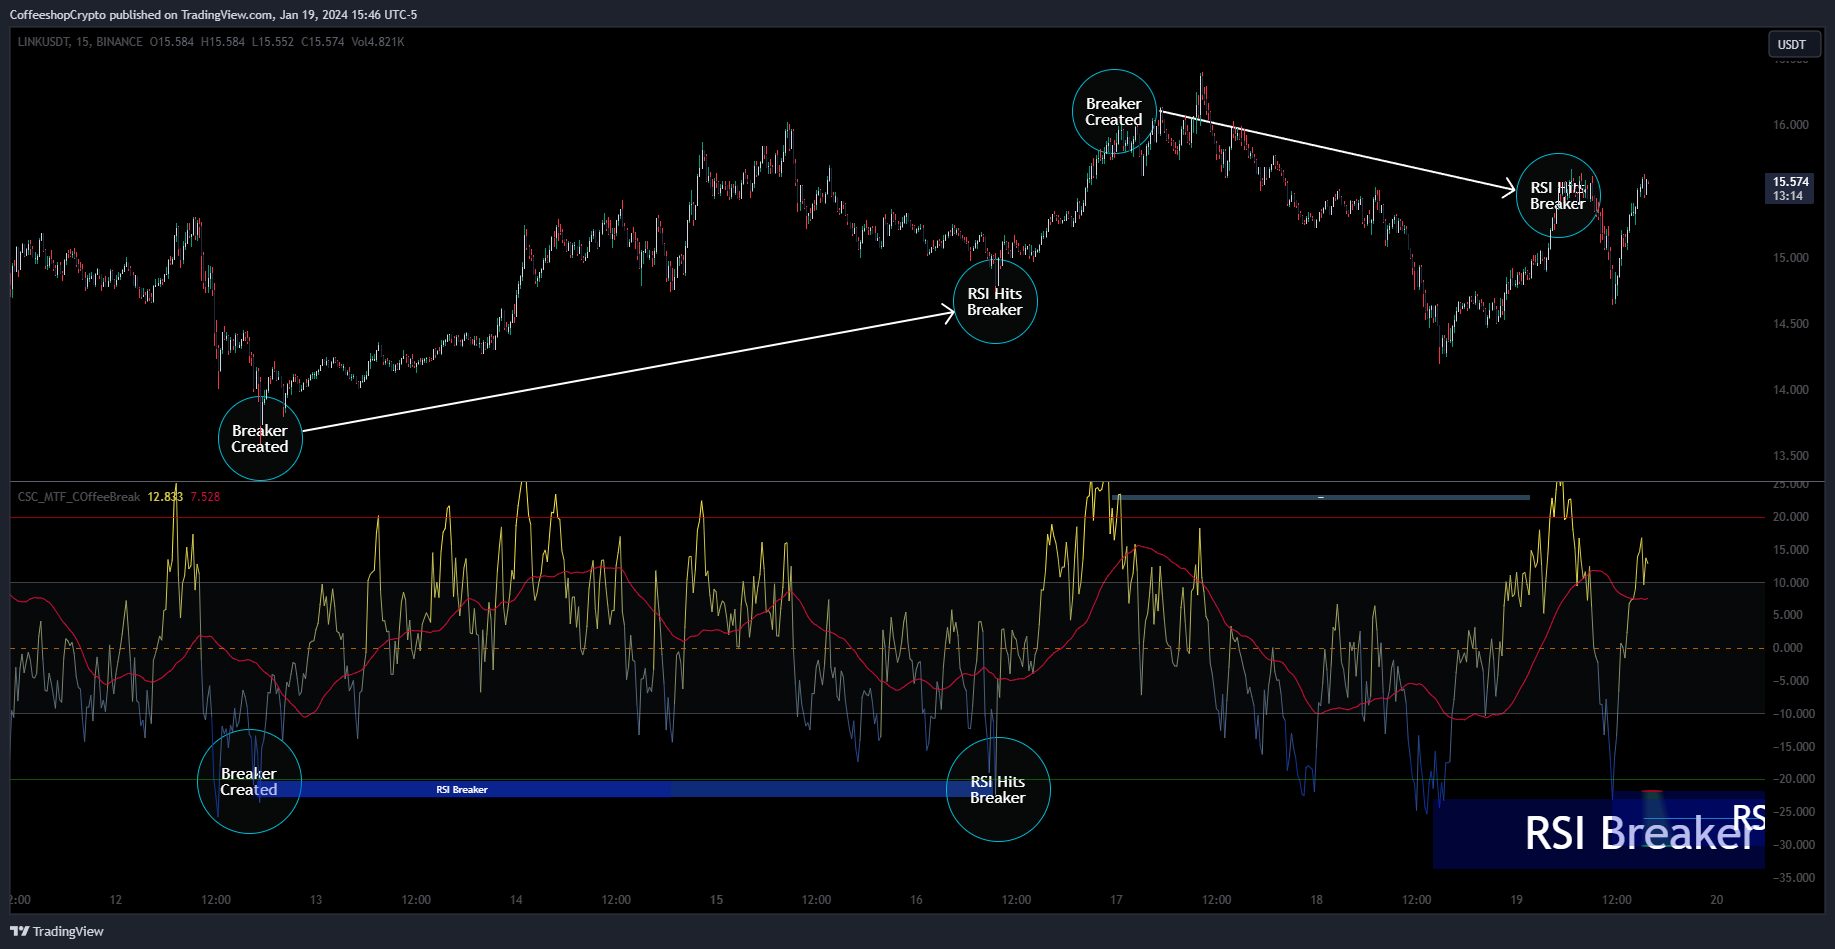
The RSI Breaker is a new zone on your oscillator that effects only the RSI itself.
Once the RSI returns to this level, you'll see a major price shift.
This is essentially the high timeframe support and resistance reversal zone for the RSI.
Once this is created, you can watch as your RSI returns to this level for an almost dead stop.
This is a high probability area for price action to go the other way.
This zone also has a sensitivity level which you can adjust to smooth out for more accuracy.
Lower sensitivity is showing more zone but less accurate.
Higher sensitivity shows less zones with higher accuracy of reversals.
Take a look below to see how it works against your RSI
---------------------------Reason for closed source----------------------------
by CoffeeShopCrypto
This indicator will be updated in the future to also produce trendlines, signals, and incorporate different methods of validate pivots and volume by calculations I have created of my own.
To avoid publishing this script more than once and give you all a direct access, without having to find a secondary or tertiary publication with the addons code is protected and will be updated here.
I have put several days into this particular script and will continue over the next few weeks to add in complimentary coding as this version of the script is really just stage one.
Access to this indicator is granted upon your agreement to stay an active member of this community. If you are away too long, the indicator will delete itself from your chart. This is in place to help the community stay communal and collaborative.
by CoffeeShopCrypto
There will no longer be "Ghosting" of indicator users.
By accepting you will be accessing a service provided by a third-party external to https://www.coffeeshopcrypto.net/
Comments 126
access granted hommie. Enjoy.
Show me how you use it with the 10 / 28.
You can start a new discussion in a group about it.
Access Granted but conditionally.
You been here a little while but have yet to contribute anything to the community conversations. Youve also made no connections with anyone on the site.
Make sure to follow the community rules otherwise the script will delete itself from your chart
A video on this would be really helpful eric. I am dyslexic when it comes to understanding things by reading loll. I am using it though trying to gauge how it works.
Love to try it, please
Some feedback on a trade I took yesterday on MNQ M1 :

Waited for the price to break the resistance (green), and on the second entry, it also broke the RSI support in Red, from CoffeeBreak, was indeed a nice trade to ride
Heres the action my friend
Each time the RSI broke below the RSI MA while dancing with the RED SUPPORT area you had a short entry.
Look at the RSI placement at these points. Its below -10 so its strong in the downtrend.
However the EXIT of shorts is when you were crossed back above the RED ZONE and back INTO the RSI ranging area (between 10 and -10)
See it?
Hey CSC can I have access to this indicator thanks
Looking for access... love your videos bro
Sorry Quest i can not.
Its been weeks you are here and you have yet to take part in any of the discussions. All you have done is take from the community but have no provided anything in return.
As stated above, to gain access to this indicator you must follow the community rules.
Looks great, love to try it. Cheers ✌🏻
Hello ,
Can you please give me access?
Sorry K. i can not.
Its been 3 weeks you are here and you have yet to take part in any of the discussions. All you have done is take from the community but have no provided anything in return.
As stated above, to gain access to this indicator you must follow the community rules.
I'd like access to this indicator .
Hi, I'd like access please
Granted. Makes sure to keep up with the community rules my friend
looking forward to this
When are you going to do a video on this indicator
Understood, is this the same indicator you used in the killzone rsi video
no thats why this is called the Coffee Break
Do you use this with any of your other indicators? I've gotten used to the Heiken Ashi Algo/BPP Void and a little eerie about replacing one of them, but worth a shot if you're looking for feedback.