CoffeeShop Crypto 10 / 28 SMAs
A lot of times you guys have heard me talk about the 10 / 28 strategy. It is a strategy that I use on high time frames mid time frames and low time frames and works wonderfully for finding liquidity rejections and continuations of trends.
This is a really simple moving average indicator that will plot out the 1028 strategy for you and I want you to notice that it is not just a 10 period moving average and a 28 period moving average because the slow moving average is actually calculated by part of the value of the fast moving average.
Since it would be more complicated to do the math for it and show you guys how to do it I Simply put it into the indicator and if you want to test it out you can take your slow moving average and change the value and you will see that it will adjust two of the moving averages. But if you change the fast moving average you will see that all of the moving averages from that point are adjusted.
HOW TO USE THIS:
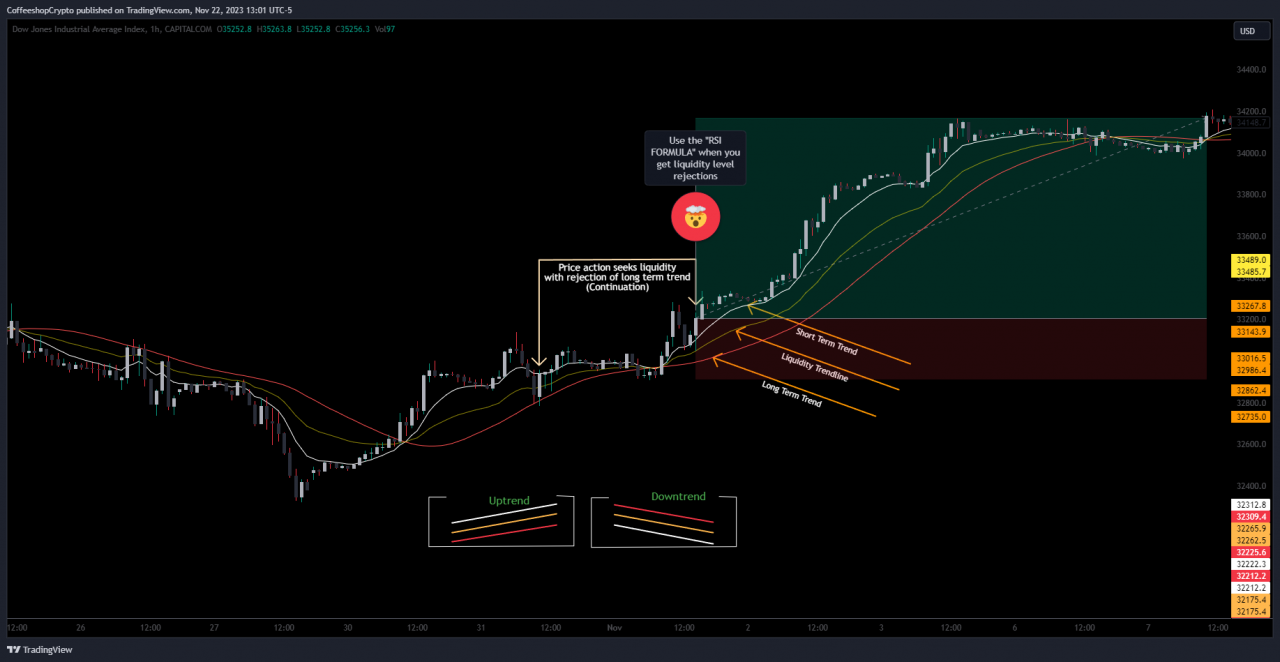
This indicator has one white line which is your fast moving average which is your short term trend.
This indicator has a red moving average which is your long term trend.
In the middle of these two you will see a liquidity trend line that is automatically plotted based off the values of the fast and slow moving average.
When price needs to continue moving in the direction that you would like it to it needs to seek liquidity from time to time so when you get a rejection of this liquidity trend line you have a strong continuation in the direction of the previous trend.
LONGS:
You wanna find your entries as you are breaking above the fast moving average. Keep in mind at times you can scalp when you break this moving average with price because price action is telling you that you are going faster than the fast term trend.
So just because you're moving averages are upside down does not mean you cannot go long on your trades.
SHORTS:
The same applies for when you are going short. You can wait for price action to break below the white line even though your moving averages are right side up as long as you are paying attention to price action and the current trend you know that you can get back into that short trade.
CONTINUATIONS:
gift for example your price action has been in an uptrend you can see that your price comes down breaks below the white line and gives you a Wick rejection of the midline which is a liquidity rejection. At this point you can see that price action simply needed to gain liquidity in the market. It sought it out. Grabbed it and it should be continuing into your long term trade.
Comment below to request access to this indicator. When access is granted, you'll get a message in your DMs
Make sure yourprofile already includes yourTradingView Username
Your access to this indicator is contingent on your agreement to follow the Activity Rule in our FAQ
- Release Notes:
Added ability to change line width
Added ability to change colors of all 3 MA
Access to this indicator is granted upon your agreement to stay an active member of this community. If you are away too long, the indicator will delete itself from your chart. This is in place to help the community stay communal and collaborative.
by CoffeeShopCrypto
There will no longer be "Ghosting" of indicator users. If you were granted access, you should be able to see the code above this message.
By accepting you will be accessing a service provided by a third-party external to https://www.coffeeshopcrypto.net/
Comments 155
Can you please give me access to the indicator. I promise I will be your hard working student 😉❤️
access granted. youll see the code below the article for this indicator
Hey broni would like to give the indicator a try
access granted. youll see the code below the article for this indicator
Hello, access request
access granted. youll see the code below the article for this indicator
Hi, can I try this indicator?
access granted. youll see the code below the article for this indicator
Acces please ✌🏻. Btw, I will use your Harsi Rsi with this strategy as in this indicator you can set te color of the Rsi MA direction. Or you recoment an other rsi? Cheers!
*heiken achi algo rsi
access granted. youll see the code below the article for this indicator
Interested to try this indicator along with CsC_RSI as per the rules in the vid. Thanks for continuing to invest in the trading community!
As stated in tye video, the csc-rsi or The Rsi KillZone is not available. It's just an RSI you need.
I'm away right now but give me a little time, I'll grant ur access
ok (AX) ur access is granted.
You should be able to add this to your charts now.
Also go over to your profile in our community and EDIT some of the features. Give yourself an avatar. Setup your profile page.
Join a discussion or start a new one.
Good day bro, please grant me access.
Hi, I've been following you for a long time with great interest!! I would love to try this indicator and stay active on this community!
I Got you my brother. Granted
Make sure to be active in the community here
Brother can you please give me access to the new indicator CoffeeShop Crypto 10 / 28 SMAs, I have registered myself on the website. Thanks
on tradingview my name is OwoJesus. Thanks.
What up Uge!! Thanks for coming through.
access granted. Make sure to be active in the community here
rother can you please give me access to the new indicator CoffeeShop Crypto 10 / 28 SMAs, I have registered myself on the website. Thanks
My email on tradingview is techsolgreem@gmail.com and my name is OwoJesus. Thanks.