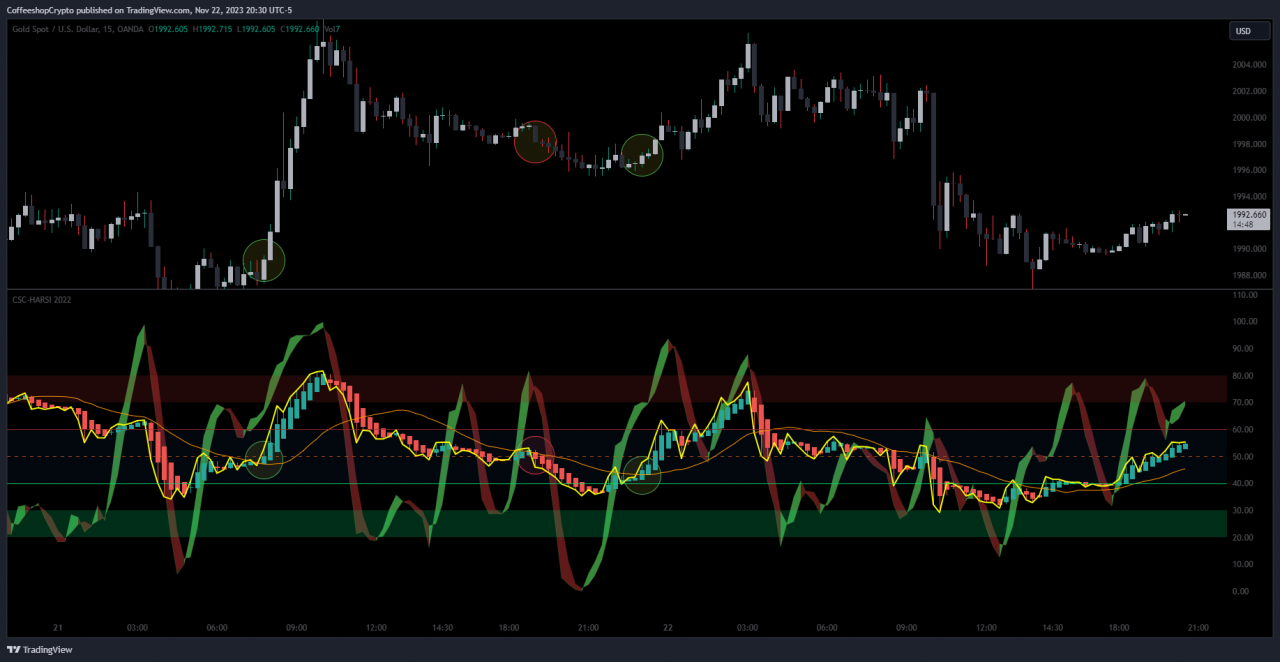
CoffeeShopCrypto HARSI 2022
What if you didn't need to wait for the RSI to go above 50 to go bullish for the RSI to go below 50 to go bearish?
What if you can see when a move in the market is just a liquidity trap?
What if you can use a vwap on something longer than a daily chart?
What if you wanted to have both Heiken Ashi candles and Japanese candles on your same chart without overlapping each other?
Did you know that even the RSI has hidden lines of support and resistance?
*********Ill be placing a full breakdown video in my profile about the script if you would rather see it in motion.*******
I'm happy to say that today's I present the release of the new version of the heikin-ashi RS (HARSI)I which is called
"The Coffeeshop Crypto HARSI"
The original HARSI is written by @JayRogers on an older Pinescript code and while it still works, Pine script continues to update their coding which is now up to version 5.
This new version of the HARSI (or rather the CSC-HARSI) is written in version 5 Pine-script. And I have developed it to be used with a secondary indicator that can give you much better returns on your trades. The second indicator is called "The Mass Effect Moving Average" and you can see it on my screen, however at the recording of this video, it is not released.
There are still a few tweaks I want to make before sending it off to Trading View so make sure to follow my profile, and you'll get the updates when it is published.
The Background:
I have been using the original HARSI indicator for about 3 months and doing a decent job getting good trades on it, however I felt it was lacking a few things so I decided to rewrite the code into version 5 Pine script and add in a few special features which you guys are going to love so stay tuned for the entire video.
(some of the dialog might look odd because this was also published to YouTube)
There is going to be a lot of information here and I'll try not to make a boring and Technically heavy vid and really keep this an exciting side for everybody so you can stick to it let's go.
Of course if there are any questions you can feel free to drop them in the comments below.
So now that the introduction and premise is over let's get on to the indicator.
-------------------THE CSC-HARSI Solves some problems the old one was missing-----------------------------------
- Heiken Ashi Plotted Candles with Open-High-Low-Close Smoothing that are individually adjustable.
What is Open-High-Low-Close individual smoothing?
In short, the Open High Low and Close are no longer all locked to a single number.
You can set the bar length of any of these, separately for any of the others.
For example: You may want to use a 10 period length for HIGH / 10 period for LOW / 21 period for Open / 50 period for close. You choose the length of each part of the candle as you like to your trading style. You don't need to follow these numbers. You can choose your own and note how the HA candles adjust on your oscillator.
- Stochastic RSI including k% and d% fill color (Stochastic RSI Ribbon) like the old version.
Stochastic RSI: is still the same
Included here is a color fill between the k% line and d% line to give you a quick visual of up or down trend. You can turn this on or off as you wish.
There is also a Stochastic RSI Length separate from the actual Stochastic Length to help smooth your ribbon.
- Relative Strength Index which we all know and love.
Relative Strength Index: now has moving averages tied to it.
We all know and love the RSI. By now most of you have been using it extensively so there is no need to go into an in depth description. But you have to see how the "RSI Moving Average PLUS'' works against this.
- Relative Strength Index Moving average (PLUS).
RSI Moving Average Plus: (LSMA and VWAP MA)
What is so PLUS about an RSI Moving average?
THE COMPARISON
Comment below to request access to this indicator. Make sure yourprofile already includes your TradingView Username
Your access to this indicator is contingent on your agreement to follow the Activity Rule in our FAQ

The most recent update to the RSI gave us the ability to switch between a few moving averages to use against the RSI signal indicating a smoothed direction of trend and breaks in trend. But I felt the signal was still too slow and too much profit was lost waiting for a break in trend confirmation.
I'm sure you've seen it too. Price rises in a rally, goes way up and then starts turning downward. I felt we needed something to tell us to get IN / OUT sooner.
- RSI based - Least Squares Moving average.
This LSMA hugs price a bit more closely and when used on a strength oscillator, almost draws a straight line from trend start to end.
The lower you set the MA length, the faster you'll see breaks in trend.
This way when there is a RALLY up or down, you'll see the exit point faster, losing less $ in the wait time.
- RSI based - VWAP
Use the VWAP MA as your 50 level. Previously you would go long only when RSI breaks above 50 and go short only when RSI breaks below 50. Now you can go long or short when it breaks above or below the level of the VWAP (Especially at the Mid Band Levels noted in the next description)
One important factor to note: When using the VWAP Moving average, it is locked to the length of the RSI. So you can not have an VWAP MA length different from your RSI length. RSI controls the VWAP MA.
- The Hidden Lines of Support and Resistance.
It comes with the use of a Vwap as a moving average which is used by mutual funds / pension funds / institutional traders, as well as day traders.
Watch the video and you'll see my explanation of the hidden lines of support and resistance at the 40 and 60 levels.
(Upper Mid Band / Lower Mid Band)
I have noticed that in each 10 of the levels of the RSI scale, both RSI and Heiken Ashi candles react to hidden areas. These areas present mainly at the 40, 50, and 60 level. I decided to plot these candles and color code them to this indicator as I am conducting a study which I will present on entries and exits at these levels. I still have more backtesting to do on it.
In another video I'll present to you HOW I do entries and exits using this indicator. Today's video is strictly about the indicator itself.
----------------------------------------------------------------------------------------------------------------------------------
----------------------------CREDITS---------------------------
Lets start with the CREDITS:
@JayRogerswww.tradingview.com/u/JayRogers/
For originating the idea. A very cool guy whom I've had the pleasure of speaking with a few times. The code he wrote was via an older version of Pine-script and needed updating to Pine v5.
-----------------------------------------------------------------
A quick note of how i would enter and exit trades.

Additional Note from the CoffeeShop Crypto:
"Watching price action is one thing. And you can be great at it but it's easy to get caught in a liquidity trap or potential stop hunts. Obviously you won't enter a trade unless there is enough volume behind that to show there's actually TRUE momentum in the market, right?
Setting your RSI MA to VWAP means you can see when a candle closes above (going bullish) or below (going bearish)."
If you see price action going bullish on your chart and the RSI has a good move, you need to make sure your Heiken Ashi candle opens below the VWAP MA and closes above the VWAP MA. This means there is true volume in the trade.
If the Green HA candle never closes above the VWAP MA, you should not enter long.
//@version=5
// This source code is subject to the terms of the Mozilla Public License 2.0 at https://mozilla.org/MPL/2.0/
// Copyright (c) 2019-present, Eric Robinson (@CoffeeshopCrypto) https://www.tradingview.com/u/CoffeeshopCrypto/
// CoffeeShopCrypto HARSI script may be freely distributed under the terms of the GPL-3.0 license.


indicator(title="Coffeeshop Crypto Heiken Ashi Oscillator", shorttitle="CSC-HARSI 2022", format=format.price, precision=2, timeframe="", timeframe_gaps=true)

//Plotting the HA Candles according to the RSI level
//This is the new 2022 version of the HARSI Originally done by @JayRogers
//Heiken Ashi


// inputs

HAp1 = input(14, title = "Open Length", tooltip="Set each of these to the bar length for your trading style.", group="Heiken Ashi O-H-L-C Smoothing")
HAp2 = input(14, title = "High Length", group="Heiken Ashi O-H-L-C Smoothing")
HAp3 = input(14, title = "Low Length", group="Heiken Ashi O-H-L-C Smoothing")
HAp4 = input(14, title = "Close Length", group="Heiken Ashi O-H-L-C Smoothing")

//_____________________________________________________
//calcs

// 4 rsi calculations
r1 = ta.rsi(close, HAp1)
r2 = ta.rsi(close, HAp2)
r3 = ta.rsi(close, HAp3)
r4 = ta.rsi(close, HAp4)

//array, stores rsi values, sorts them
heikinarray = array.new_float(0, 0)
array.push(heikinarray, r1)
array.push(heikinarray, r2)
array.push(heikinarray, r3)
array.push(heikinarray, r4)
array.sort(heikinarray, order.descending)

// assign open, high, low, ,close
h = array.get(heikinarray, 1)
c = array.get(heikinarray, 3)
o = array.get(heikinarray, 0)
l = array.get(heikinarray, 2)

//_____________________________________________________
// Heikin Ashi source function. All credits to allanster: https://www.tradingview.com/script/HtNYMuBO-Heikin-Ashi-Source-Function/
// slightly modified to allow for different inputs

src(_o, _h, _l, _c, _src)  =>
    Close  = (_o+_h+_l+_c)/4
    Open   = float(na)
    Open  := na(Open[1]) ? (_o + _c) / 2 : (nz(Open[1]) + nz(Close[1])) / 2
    High   = math.max(_h, math.max(Open, Close))
    Low    = math.min(_l,  math.min(Open, Close))
    HL2    = math.avg(High, Low)
    HLC3   = math.avg(High, Low, Close)
    OHLC4  = math.avg(Open, High, Low, Close)
    Price  = _src == 'close' ? Close : _src == 'open' ? Open : _src == 'high' ? High : _src == 'low' ? Low : _src == 'hl2' ? HL2 : _src == 'hlc3' ? HLC3 : OHLC4

hi = src(o, h, l, c, 'high' )
cl = src(o, h, l, c, 'close')
op = src(o, h, l, c, 'open' )
lo = src(o, h, l, c, 'low'  )

hi1 = src(op, hi, lo, cl, 'high' )
cl1 = src(op, hi, lo, cl, 'close')
op1 = src(op, hi, lo, cl, 'open' )
lo1 = src(op, hi, lo, cl, 'low'  )

//_____________________________________________________

barColor   = cl1 > op1 ? #26a69a : #ef5350 // series color
plotcandle(op1, hi1, lo1, cl1, title = "HA Candle", color = barColor, wickcolor = barColor, bordercolor = barColor)

/////End Heiken Ashi Candles

//Lets get to working on the Stochastic RSI
smoothK = input.int(21, title="K%", minval=1, group="Stochastic Inputs")
smoothD = input.int(5, title="D%", minval=1, group="Stochastic Inputs")
lengthRSI = input.int(21, "Stochastic RSI Length", minval=1, group="Stochastic Inputs")
lengthStoch = input.int(50, "Stochastic Length", minval=1, group="Stochastic Inputs")
src = input(close, title="Stochastic RSI Source", group="Stochastic Inputs")
rsi1 = ta.rsi(src, lengthRSI)
k = ta.sma(ta.stoch(rsi1, rsi1, rsi1, lengthStoch), smoothK)
d = ta.sma(k, smoothD)
p1 = plot(k, title="K%", color=color.new(#5de661, 82))
p2 = plot(d, title="D%", color=color.new(#a12a2a, 82))
h0 = hline(80, "Upper Band", color=#787B86, editable=false, display=display.none)
hline(50, "Middle Band", color=color.new(#cc5b1f, 20))
h1 = hline(20, "Lower Band", color=#787B86,editable=false, display=display.none)
fill(h0, h1, color=color.rgb(33, 150, 243, 90), title="Background", editable=false, display=display.none)
fill(title = "Stochastic RSI Ribbon", plot1 = p1, plot2 = p2, color = k >= d ? color.new(#5de661, 40) : color.new(#a12a2a, 40))

//END FAST STOCHASTIC

//------------------------------------------------------------------------------
//RSI UPDATED Original Coding

ma(source, length, type) =>
    switch type
        "SMA" => ta.sma(source, length)
        "Bollinger Bands" => ta.sma(source, length)
        "EMA" => ta.ema(source, length)
        "SMMA (RMA)" => ta.rma(source, length)
        "WMA" => ta.wma(source, length)
        "VWMA" => ta.vwma(source, length)
        "LSMA" => ta.linreg(source, length, offset=0)
        "VWAP" => ta.vwap(source)

rsiLengthInput = input.int(14, minval=1, title="RSI Length", step=1, group="Relative Strength Input Settings")
rsiSourceInput = input(close, "RSI Source", group="Relative Strength Input Settings")
maTypeInput = input.string("VWAP", title="MA Type", options=["SMA", "Bollinger Bands", "EMA", "SMMA (RMA)", "WMA", "VWMA", "LSMA", "VWAP"], tooltip="Average out the RSI and its candles. VWAP MA is not adjustable. It follows RSI input length.", group="RSI MA Settings")
maLengthInput = input.int(21, title="MA Length", group="RSI MA Settings")
bbMultInput = input.float(2.0, minval=0.001, maxval=50, title="BB StdDev", group="RSI MA Settings")
offset=input(title="RSI MA Offset", defval=0, group="RSI MA Settings")

up = ta.rma(math.max(ta.change(rsiSourceInput), 0), rsiLengthInput)
down = ta.rma(-math.min(ta.change(rsiSourceInput), 0), rsiLengthInput)
rsi = down == 0 ? 100 : up == 0 ? 0 : 100 - (100 / (1 + up / down))
rsiMA = ma(rsi, maLengthInput, maTypeInput)
isBB = maTypeInput == "Bollinger Bands"
//Stochastic BUY SELL
Rng = ta.cross(rsi, rsiMA) ? rsiMA : na

//Supply and Demand Calculations

BullRng = ta.cross(rsi, rsiMA) ? rsiMA : na
BullRange = BullRng and (rsi == rsiMA and op < cl)
plotshape(BullRange, title="Resistance Levels", text="Resistsance", textcolor=color.new(#f7525f, 0), color=color.new(#f7525f, 0), location=location.top, style=shape.circle, display=display.all - display.status_line)

BearRng = ta.cross(rsi, rsiMA) ? rsiMA : na
BearRange = BearRng and (rsi == rsiMA and op > cl)
plotshape(BearRange, title="Support Levels", text="Support", textcolor=color.new(#4caf50, 0), color=color.new(#4caf50, 0), location=location.bottom, style=shape.circle, display=display.all - display.status_line)

/////////////////////////S/R Reversal for up-trend downtrend//////////////////

Bullx = ta.cross(rsi, rsiMA) ? rsiMA : na
BullRreject = Bullx and (rsi[2] < rsiMA and rsi[1] == rsiMA[1] and rsi < rsiMA)
plotshape(BullRreject, title="Bull Rejection", text="Bull Rejection", textcolor=color.white, color=color.red, location=location.bottom, style=shape.arrowdown, display=display.all - display.status_line)

Bearx = ta.cross(rsi, rsiMA) ? rsiMA : na
BearReject = Bearx and (rsi[2] > rsiMA and rsi[1] == rsiMA[1] and rsi > rsiMA)
plotshape(BearReject, title="Bear Rejection", text="Bear rejection", textcolor=color.white, color=color.green, location=location.top, style=shape.arrowup, display=display.all - display.status_line)

plot(rsi, title="RSI", color=#f6fa05, linewidth=2)

///////Lets get back to the rest of the plotting. OH THE PLOTTING HAS ME PLOTZED//
plot(rsiMA, "RSI-based MA", color=color.orange, linewidth=1, style=plot.style_line)

//Plots for Entry Positions Alerts
fiftyscalp = ta.crossover(rsi, 40) ? rsi : na
Buy = fiftyscalp and (rsi[1] < 40 and rsi > 40)
plotshape(Buy, title="Buy", text="50 SCalp", textcolor=color.green, color=color.green, location=location.bottom, style=shape.arrowup, display=display.all - display.status_line)

rsiUpperBandOB = hline(80, "RSI Overbought", color=#787B86, display=display.none)
rsiUpperBandOS = hline(20, "RSI OverSold", color=#787B86, display=display.none)
rsiUpperBand = hline(70, "RSI Upper Band", color=#787B86, display=display.none)
rsiLowerBand = hline(30, "RSI Lower Band", color=#787B86, display=display.none)
hMIDhi = hline(60, "Upper Mid Band", color=color.new(#a12a2a, 15), linestyle=hline.style_solid)
hMIDlo = hline(40, "Lower Mid Band", color=color.new(#00E676, 15), linestyle=hline.style_solid)
fill(rsiUpperBand, rsiLowerBand, color=color.rgb(126, 87, 194, 90), title="RSI Background", display=display.none)
bbUpperBand = plot(isBB ? rsiMA + ta.stdev(rsi, maLengthInput) * bbMultInput : na, title = "Upper Bollinger Band", color=color.green)
bbLowerBand = plot(isBB ? rsiMA - ta.stdev(rsi, maLengthInput) * bbMultInput : na, title = "Lower Bollinger Band", color=color.new(#a12a2a, 0))
fill(bbUpperBand, bbLowerBand, color= isBB ? color.new(color.green, 90) : na, title="Bollinger Bands Background")
fill(rsiUpperBandOB, rsiUpperBand, color=color.new(#a12a2a, 80), title="Overbought Background")
fill(rsiUpperBandOS, rsiLowerBand, color=color.new(#00E676, 80), title="Oversold Background")
fill(hMIDhi, hMIDlo, color=color.new(#3179f5, 94), title="Midrange Background")

//-----------------------END RSI UPDATED-----------------------------
This code and its accompanying content ("Digital Property") is the exclusive intellectual property of Eric Robinson, the owner of CoffeeShopCrypto.net ("CoffeeShopCrypto"). The Digital Property is protected under applicable intellectual property laws and is subject to the terms outlined in our Privacy Policy.
1. Ownership and Confidentiality: a. This Digital Property is the sole creation of Eric Robinson and is owned by CoffeeShopCrypto. b. Any unauthorized distribution, reproduction, or dissemination of this Digital Property is strictly prohibited.
2. Restriction on Distribution: a. This Digital Property is intended solely for use by individuals employed by CoffeeShopCrypto.net. b. No person or entity, other than those affiliated with CoffeeShopCrypto.net, is authorized to distribute or redistribute this Digital Property in any form.
3. Legal Consequences: a. Unauthorized distribution or redistribution of this Digital Property may result in legal action. b. Any entity found hosting, distributing, or otherwise making this Digital Property available without explicit authorization will be held liable for theft and intent to redistribute stolen digital property.
4. Legal Action: a. In the event that this Digital Property is discovered elsewhere online without proper authorization: i. CoffeeShopCrypto reserves the right to pursue legal action against the responsible entity. ii. Both CoffeeShopCrypto and the entity found with the Digital Property may initiate legal proceedings for the distribution of stolen digital property.
5. Investigation: a. Any activities that involve uploading, copying, placing, or making this Digital Property available without authorization will be subject to thorough investigation. b. Parties found engaging in such activities may face legal consequences.
By accessing this Digital Property, you acknowledge and agree to abide by the terms outlined herein. Any violation may result in legal action.
Access to this indicator is granted upon your agreement to stay an active member of this community. If you are away too long, the indicator will delete itself from your chart. This is in place to help the community stay communal and collaborative.
by CoffeeShopCrypto
There will no longer be "Ghosting" of indicator users.
By accepting you will be accessing a service provided by a third-party external to https://www.coffeeshopcrypto.net/
Comments 53
Yes, I have added the code into my TV and have it on my chart now. It really is a great indicator. I'm currently back and forward testing US30, NAS100 and UK100. Looking really promising so far.
Was there not a newer Heiken Ashi Algo available too? No problem if not but thought I'd ask.
So I have only been watching the CSC_Coffeebreak run live for a few days but I am impressed. The video you made based on a members question about the S/R zones where you extended the zones based on the candle it formed at...super helpful!
I would love to give the HARSI a go please, TV user = mabevis67 (it is in my profile as well)
I requested earlier and requesting again , kindly provide me the access for HARSI indicator.
Not sure if I'm too late but can I also request for access to this indicator?
Dear Sir,
Excuse me , Could I get access this indicator-CSC HARSI 2022 ?
Thank you so much.
Hi Can i please have access?
thanks
Hi Can i please have access?
thanks
my TradingView - @vimmi1
hi i hope you are doing well.
i will appreciate if let me know how can i have coffeeshopcrypto Hrasi 202
The code is right here on the page.
Hello CoffeeShopCrypto. I started testing your indicator CoffeeShopCrypto HARSI 2022 when it was freely available on TV. However, the war (I'm from Ukraine) changed my priorities. At the moment, I would like to continue testing your CoffeeShopCrypto HARSI 2022. Can I get it again now? Thank you in advance! With respect and gratitude to you for what you do for us all!
dude. take the time to read the post here. the code for it is directly above you. its in the article.
the HARSI 2022 was always free and still is.
If you are talking about the Premium KillZone or the CoffeeBreak RSI those are almost the same but they arent free. These two are the ones i had people testing.
are either of those the ones you are talking about?
Hi CoffeeShopCrypto. Thank you for your answer. Unfortunately, I did not find "CoffeeShopCrypto HARSI 2022" in the "TV" script search engine. I also cannot find the embed code on your site. I do not know why this is so, maybe I am just a "slowpoke", but I cannot find it. I have a strange question for you: According to your knowledge and experience, if we compare: accuracy, ease of use and efficiency. Which of your indicators do you think is the most masterpiece? "CoffeeShopCrypto HARSI 2022" or "Heiken Ashi Algo Premium KillZone" or "Heiken Ashi Algo v6". Thank you for your talented indicators and advice on choosing.
By FAR it is the KillZone
Here is a link to it HARSI KillZone on TradingView
I dont say this because its an invite-only script. Its the REASON i made it an invite only. This indicator is a 1005 inclusion of all the things i know and use in momentum strategies in a single indicator.
There are ways to see:
PullBack
Continuations
Divergences
False breakouts
Actual trending markets
True Ranging market
A Dynamic point of equilibrium
You can even view if the following items are moving within their Premium or Discount values (The RSI, The RSI Moving Average, the High Timeframe RSI)
This is the ONLY oscillator that gives you real time values of High Timeframe RSI without having to switch charts.
You can fine tune your HTF RSI to minutes. For example, you can be on a 15 minute chart looking at a 21 minute RSI and your current RSI. No other script can do this without lagging. This one does it in real time, no waiting for higher candles to close.
In a comming update, ill be activating the liqidity sweep levels which you can use as targets on your price chart. This means the Indicator while at the bottom of your screen, will draw horizontal lines at price levels on your price candles telling you where price needs to get to, so liquidity can be swept.
This means where the line begins, youll be notified that liquidity has entered the market. These points can be used as targets when price starts moving back towards these levels.
You can use ICT strategies to treat these liquidity sweeps as continuations or price bounces.
The liquidity levels will be based on your sensitivity setting within the indicator. The more sensitive, the less liquidity youll see because more sensitive is closer to REAL time chart market structure and liquidity is often created on higher timeframes then you are watching.
While the other two indicators (Algo v6 and HARSI 2022) are great tools, the HARSI 2022 is outdated and will produce very late limited results. The v6 is good for trends but it is in no way dynamic as the market is so again, you can use it very well only under certain conditions of market volatility.
The KillZone solves all the problems of having to adjust an indicator as the market volume and volatility adjusts on its own.
In the meantime im working on a way to give you access to the code.