Heiken Ashi Algo v6 Free
The return of the Heiken Ashi Algo is finally Here.
The Heiken Ashi Algo Oscillator v6, introduces a refined approach to technical analysis applicable across various markets. Central to this algorithm is the integration of the Relative Strength Index #RSI, a staple indicator renowned for its effectiveness in measuring momentum.
The RSI - Tried and True:
By incorporating the #RSI, traders gain valuable insights into the speed and strength of price movements, aiding in the identification of potential #trend #reversals and #continuations.
Why Heiken Ashi Candles:
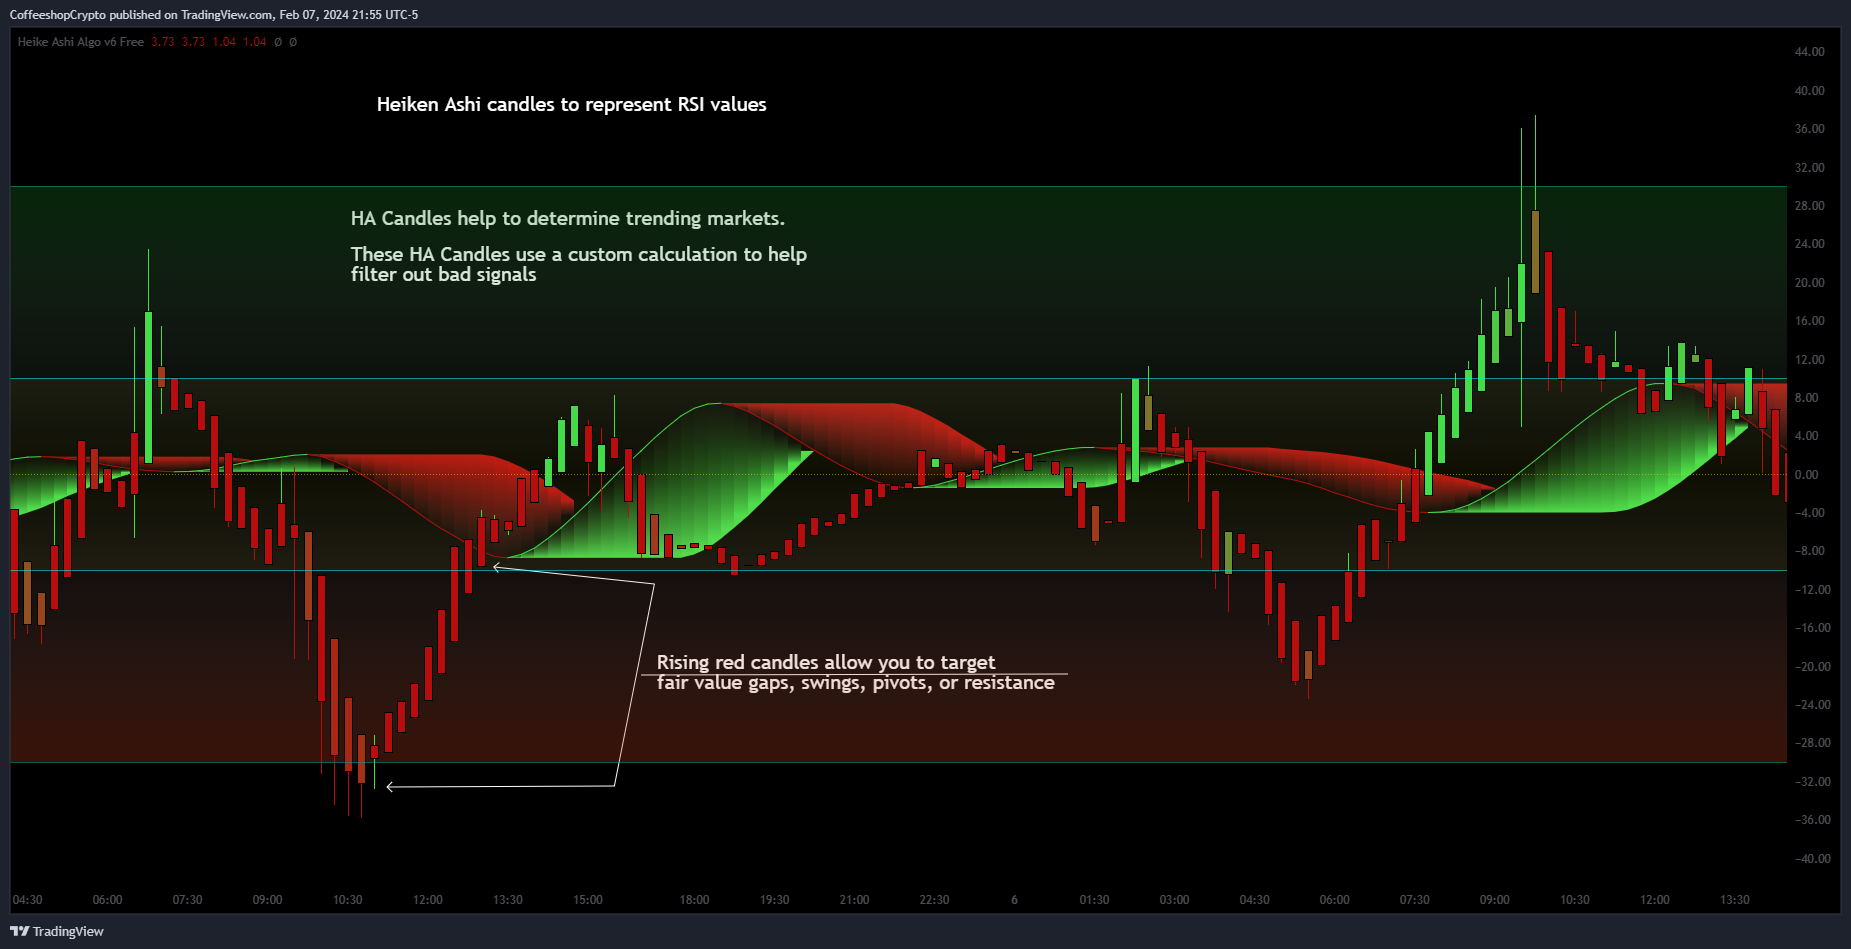
Additionally, the utilization of #Heiken Ashi candles within this algorithm offers a smoother representation of price action, reducing noise and enhancing clarity in trend analysis. This feature is particularly advantageous in volatile markets, where traditional candlestick patterns may produce false signals. By employing Heiken #Ashi candles, traders can more accurately identify underlying trends and make informed decisions based on reliable price data.
Combining RSI and Heiken Ashi:
The synergy between the RSI and Heiken Ashi candles in the Heiken Ashi Algo Oscillator v6 provides traders with a comprehensive perspective on both momentum and trend direction. This combination allows for a nuanced analysis of market dynamics, enabling traders to navigate various market conditions with greater confidence.
Heiken Ashi Candle Sizes:
The size of the Heiken Ashi candles serves as a visual indicator of the distance the RSI has moved between closing prices, offering additional insights into momentum shifts.
Not your average Heiken Ashi Candles:
Ive taken the time to do some serious custom coding for these particular Heiken Ashi Candles.
They do NOT color as the normal ones do. There is a setting in the inputs tab of the indicator that allows you to color them according to my secret code where its looking for Breaks of Structure on lower timeframes based on Heiken Ashi Candle calculations.
Turning on this feature gives you a more promising array of candle colors telling you about false or positive breakouts and trends.
Why choose this tool:
CoffeeShopCrypto's Heiken Ashi Algo Oscillator v6 offers a balanced and effective tool for traders across different markets. By leveraging the power of the RSI and Heiken Ashi candles, traders can enhance their decision-making process, identify trading opportunities with greater precision, and ultimately improve their overall trading performance.
------------------------------------------HOW TO USE IT------------------------------------------
Inflow / Outflow (accumulation and distribution) Ribbon
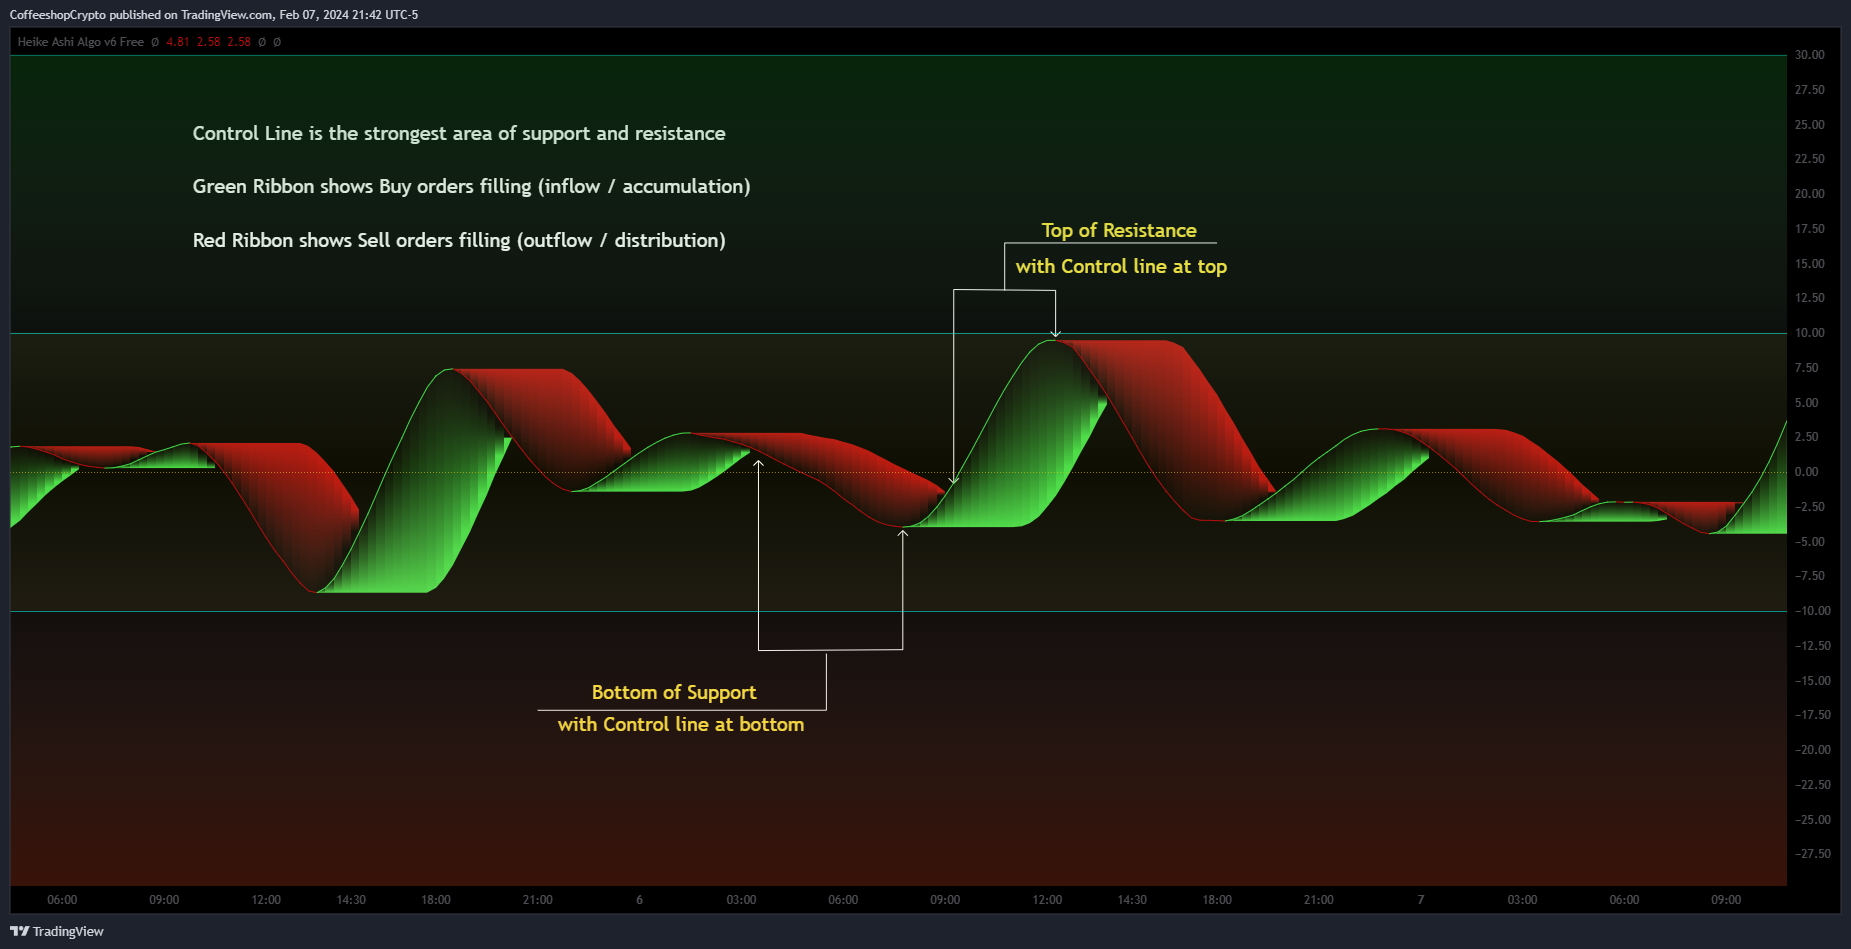
In trading we know liquidity means volume and volume is orders. This ribbon shows you when orders are entering, exiting, filling or flat in the market.
The Liquidity Ribbon is a visual representation of whats happening with accumulation and distribution in the market.
It acts as a dynamic area of support and resistance for the RSI (momentum).
Once the RSI breaks above or below the full area of the ribbon, you have an overturned short term market.
Breaking this area isn't easy because of the one sided thick line known as the PoC line or Point of Control Line.
This line changes between a rising and falling color to tell you what side of the market has the most resistance or support.
The common way for HA candles to be colors is green for bullish and red for bearish.
These candles color differently according to market dynamics vs how the current candle closes.
This is helpful to keep you from taking longs or shorts when the momentum just doesn't have the move.
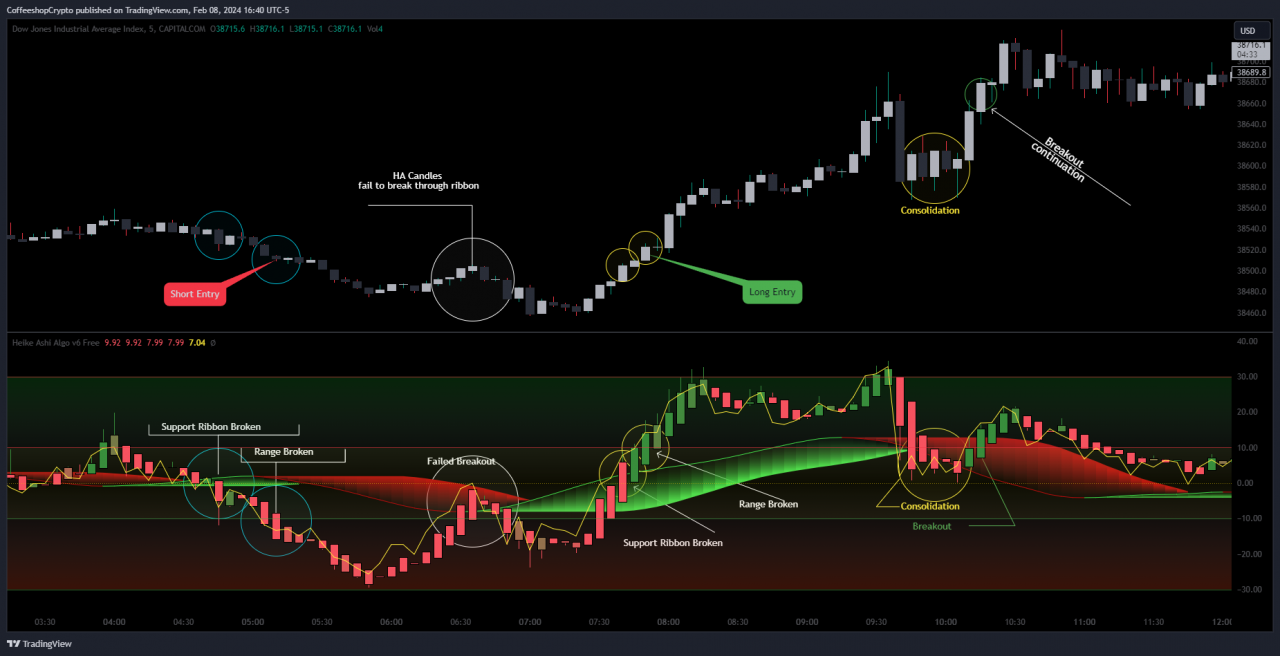
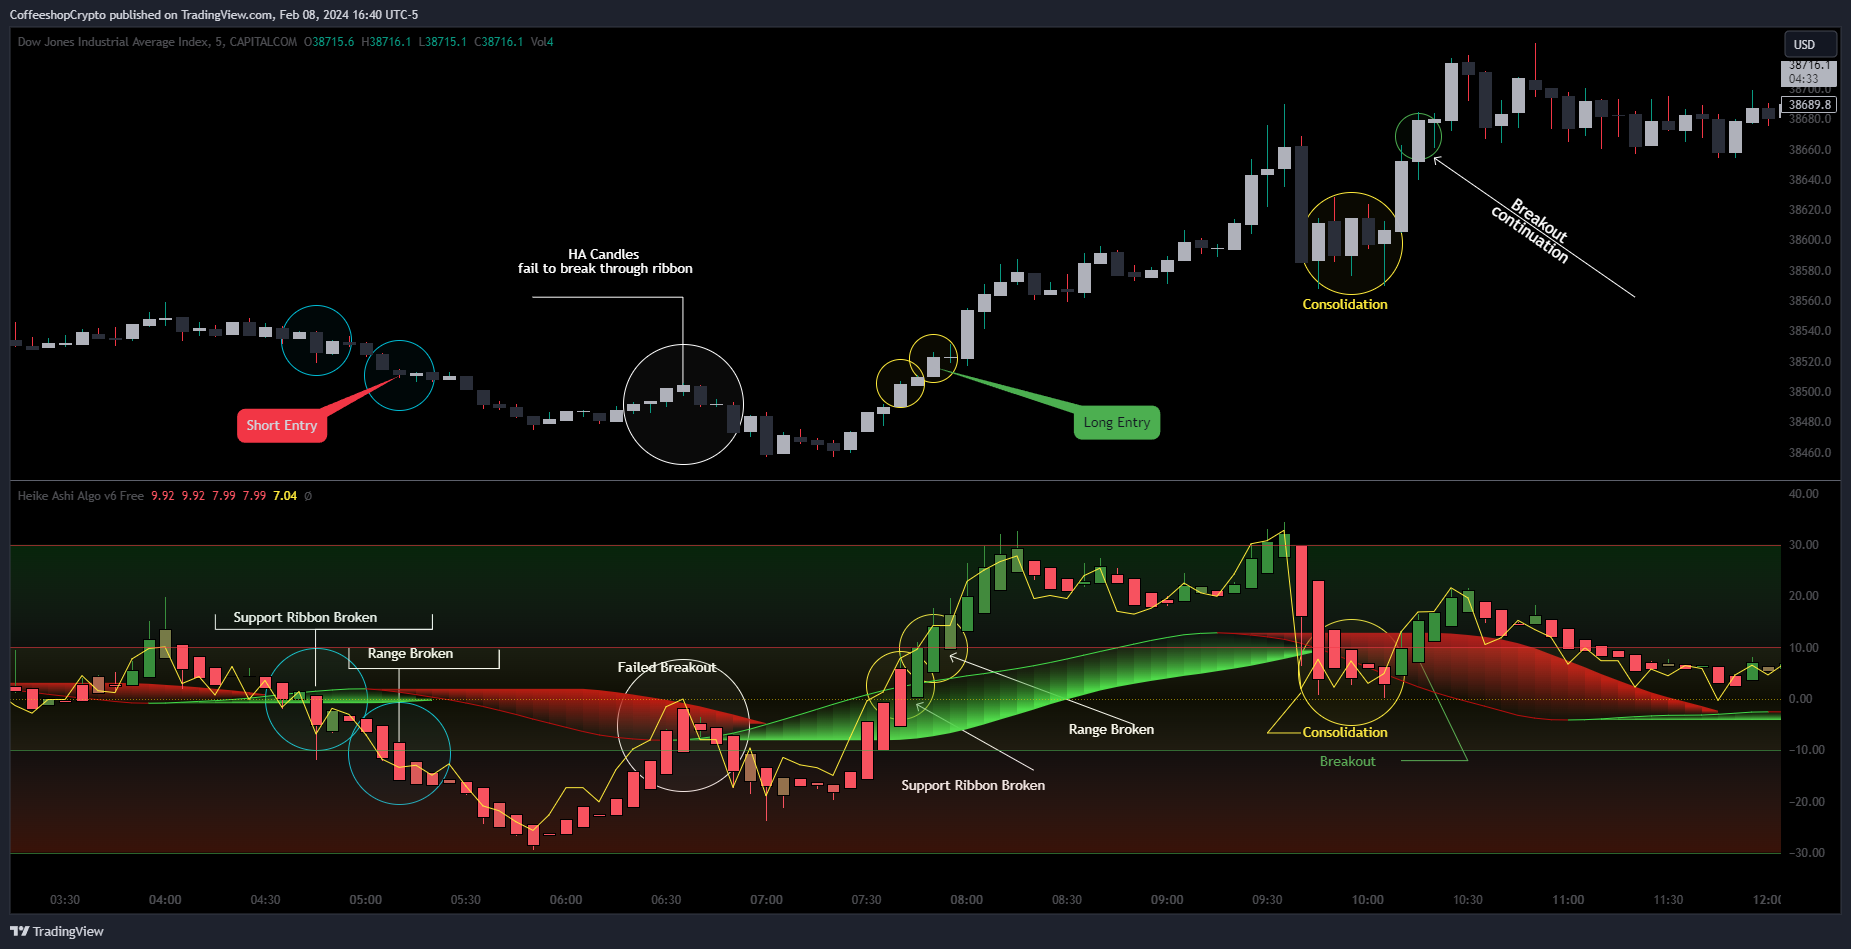
In the image above (left to right) you can see the following take place:
Short Entry:
HA Candles push down through the ribbon breaking below its low side (Support Ribbon Broken)
Following this the RSI RANGE is broken to the down side.
This is a good setup for a short breakout
Retrace to false breakout:
After this price retraces and so does momentum.
HA Candles attempt to but fail to break through the top of the ribbon and push back down . This is a false breakout.
Bullish Divergence to Long Entry:
The Heiken Ashi Algo forms a bullish divergence and HA candles push back up into the ribbon. Without a change in candle structure the RSI breaks the top of the ribbon where the control line sits as well as breaking through the top of the RANGE area and
This is a promising setup for a long trade.
Rally Base Rally: (into secondary long trade)
As price is rising, it retraces until HA candles are within the RANGE. No candle closes or has a low below the RSI midline.
HA Candles are forming a consolidation. After consolidation the RSI breaks out the top of the ribbon and the top of the RANGE allowing a secondary long entry.
I'm not gonna lie. Ive written a lot of tutorials but this one was probably the most exciting to describe.
by CoffeeShopCrypto
If you have any questions please do ask below.
By accepting you will be accessing a service provided by a third-party external to https://www.coffeeshopcrypto.net/


Comments 43
Hey ! Great improvment !

There are some candles that are between red and green, what's their meaning?
Armageddon is hereeeee
ahahahaahahaaahah
I was pushing fir that game release date too but here we are
Thanks for the Algo
Thanks for checking in buddy
And here thought I was going to have a boring night… thanks for the release Eric!
Not gonna lie, I walked away from the computer several times over the past week. Thus was a killer. So many things were implemented and removed
🔥🔥 super keen to try V6
I just heard Chuck Norris gave this approval so its unbeatable.
Just a side note, can the pivot trend line and pivot high and lows be added back
Those were extremely clunky and often gave confusing signals. Not false but confusing. I have something new coming
Finally (The Rock Voice) CSC has come back with another bad ass indicator . love this new ashi algo eric. its easier to read the trends. only issue i got was the ribbon was hard to see until i turn off the ob n os in the style section. but great job as usual. now when can we get the bull bear power void or the macd???.
Void is still avail on tradingview isn't it?
Also u don't have e to turn off the ob and os lines. U can alter their transparency though and change the color
Hey Eric in your strat videos. can you include a futures trading strat with the ashi algo. futures and passing propfirm challenges seems to be trending right now. title it Pass Propfirm challenge with the heiken ashi algo. lol just a thought
I think that would be too specific. Id have to convert a strategy to a single timeframe and analysis use case. A lot of people would take that and only attempt to trade it as a strategy on that particular set of rules. Instead id like to offer the information on how to perceive what the Algo v6 is telling you. This way you can develop your OWN strategy based on what TF you use, other confluences, asset type, etc.
Great work ! 👏🏼🙌🏽💫
As usual GREAT WORK!
One suggestion - in the old V3 you have added some pivot trendlines which was also very usefull and helping filter even more accurate the breakouts. Can you add them here also?
Guys, suggestion - who have bought the coffeebreak - combine the 2 indicators! who is considering buying it - do it asap

Wow! That's incredible man. Good work.
All my indicators ae designed to be able to be combined to help broaden the use ti different types of traders
Nice! I had the same idea and started implementing it last night.
If anyone else is playing with the indicators like this make sure you right-click on the chart over the side axis and merge the scales. When you first merge the indicators, you will have a scale on the left side and a scale on the right side. That will keep it from separating the two indicators apart as you move the chart.
After seeing this I'm working on it.