Heiken Ashi Algo v6 Free
The return of the Heiken Ashi Algo is finally Here.
The Heiken Ashi Algo Oscillator v6, introduces a refined approach to technical analysis applicable across various markets. Central to this algorithm is the integration of the Relative Strength Index #RSI, a staple indicator renowned for its effectiveness in measuring momentum.
The RSI - Tried and True:
By incorporating the #RSI, traders gain valuable insights into the speed and strength of price movements, aiding in the identification of potential #trend #reversals and #continuations.
Why Heiken Ashi Candles:
Additionally, the utilization of #Heiken Ashi candles within this algorithm offers a smoother representation of price action, reducing noise and enhancing clarity in trend analysis. This feature is particularly advantageous in volatile markets, where traditional candlestick patterns may produce false signals. By employing Heiken #Ashi candles, traders can more accurately identify underlying trends and make informed decisions based on reliable price data.
Combining RSI and Heiken Ashi:
The synergy between the RSI and Heiken Ashi candles in the Heiken Ashi Algo Oscillator v6 provides traders with a comprehensive perspective on both momentum and trend direction. This combination allows for a nuanced analysis of market dynamics, enabling traders to navigate various market conditions with greater confidence.
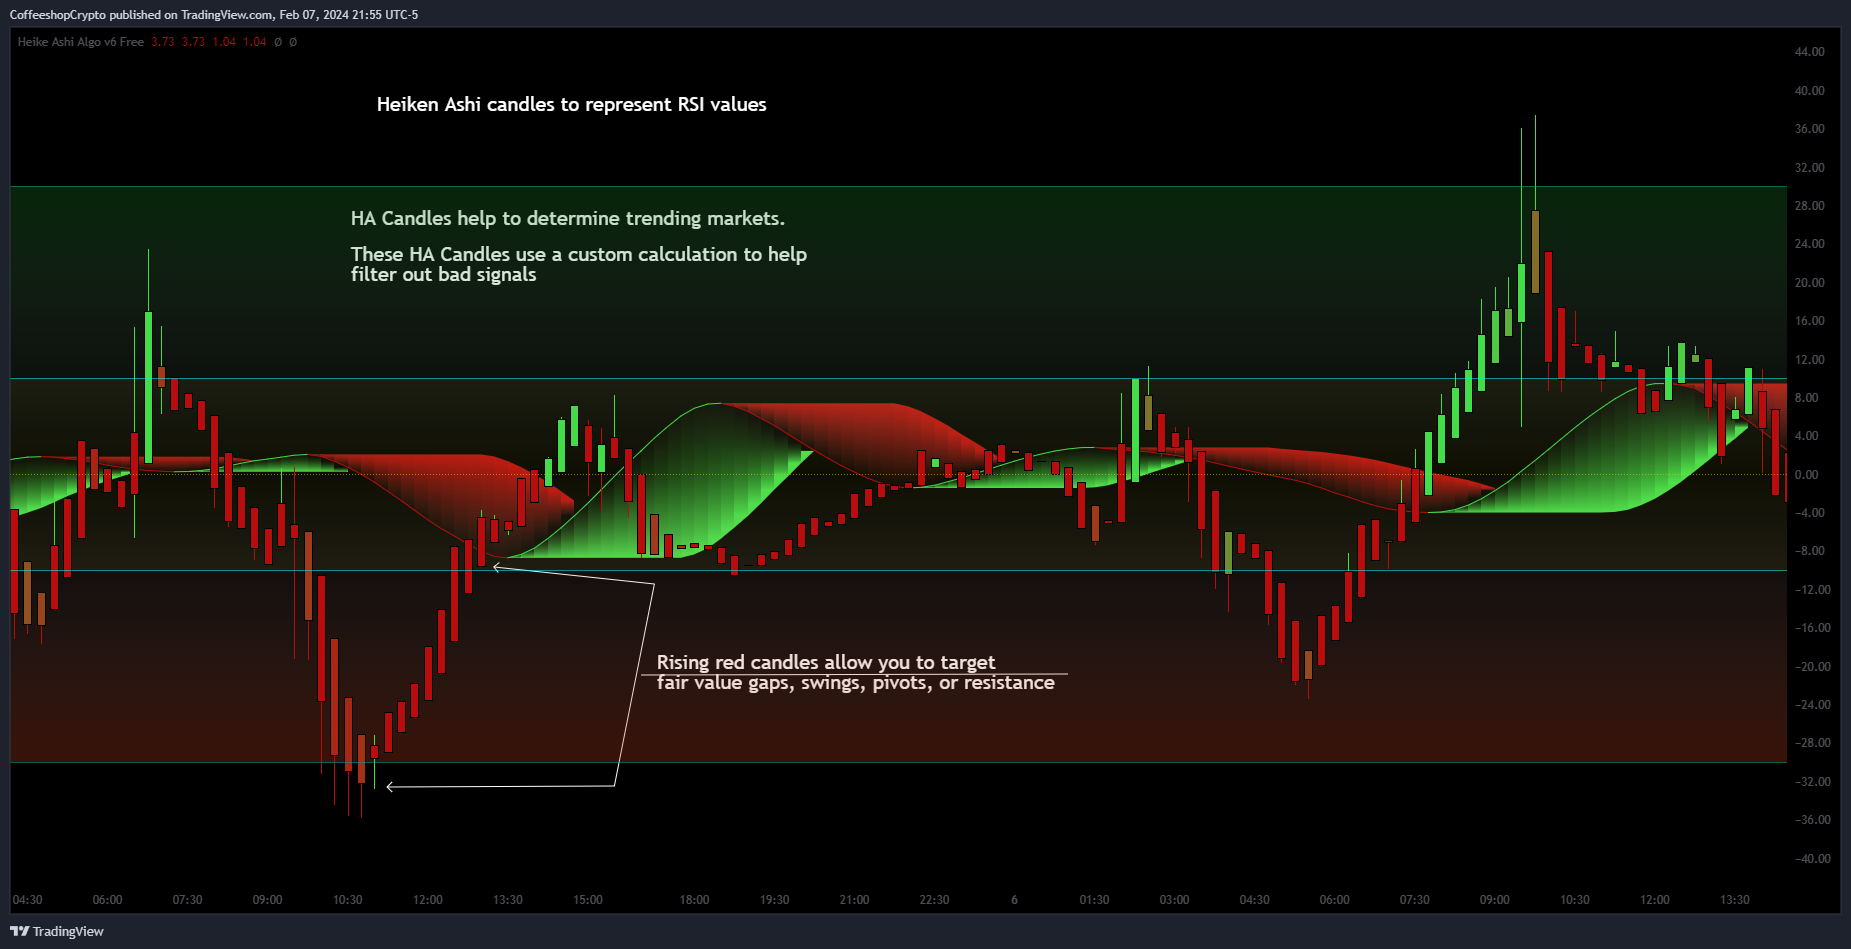
Heiken Ashi Candle Sizes:
The size of the Heiken Ashi candles serves as a visual indicator of the distance the RSI has moved between closing prices, offering additional insights into momentum shifts.
Not your average Heiken Ashi Candles:
Ive taken the time to do some serious custom coding for these particular Heiken Ashi Candles.
They do NOT color as the normal ones do. There is a setting in the inputs tab of the indicator that allows you to color them according to my secret code where its looking for Breaks of Structure on lower timeframes based on Heiken Ashi Candle calculations.
Turning on this feature gives you a more promising array of candle colors telling you about false or positive breakouts and trends.
Why choose this tool:
CoffeeShopCrypto's Heiken Ashi Algo Oscillator v6 offers a balanced and effective tool for traders across different markets. By leveraging the power of the RSI and Heiken Ashi candles, traders can enhance their decision-making process, identify trading opportunities with greater precision, and ultimately improve their overall trading performance.
------------------------------------------HOW TO USE IT------------------------------------------
Inflow / Outflow (accumulation and distribution) Ribbon
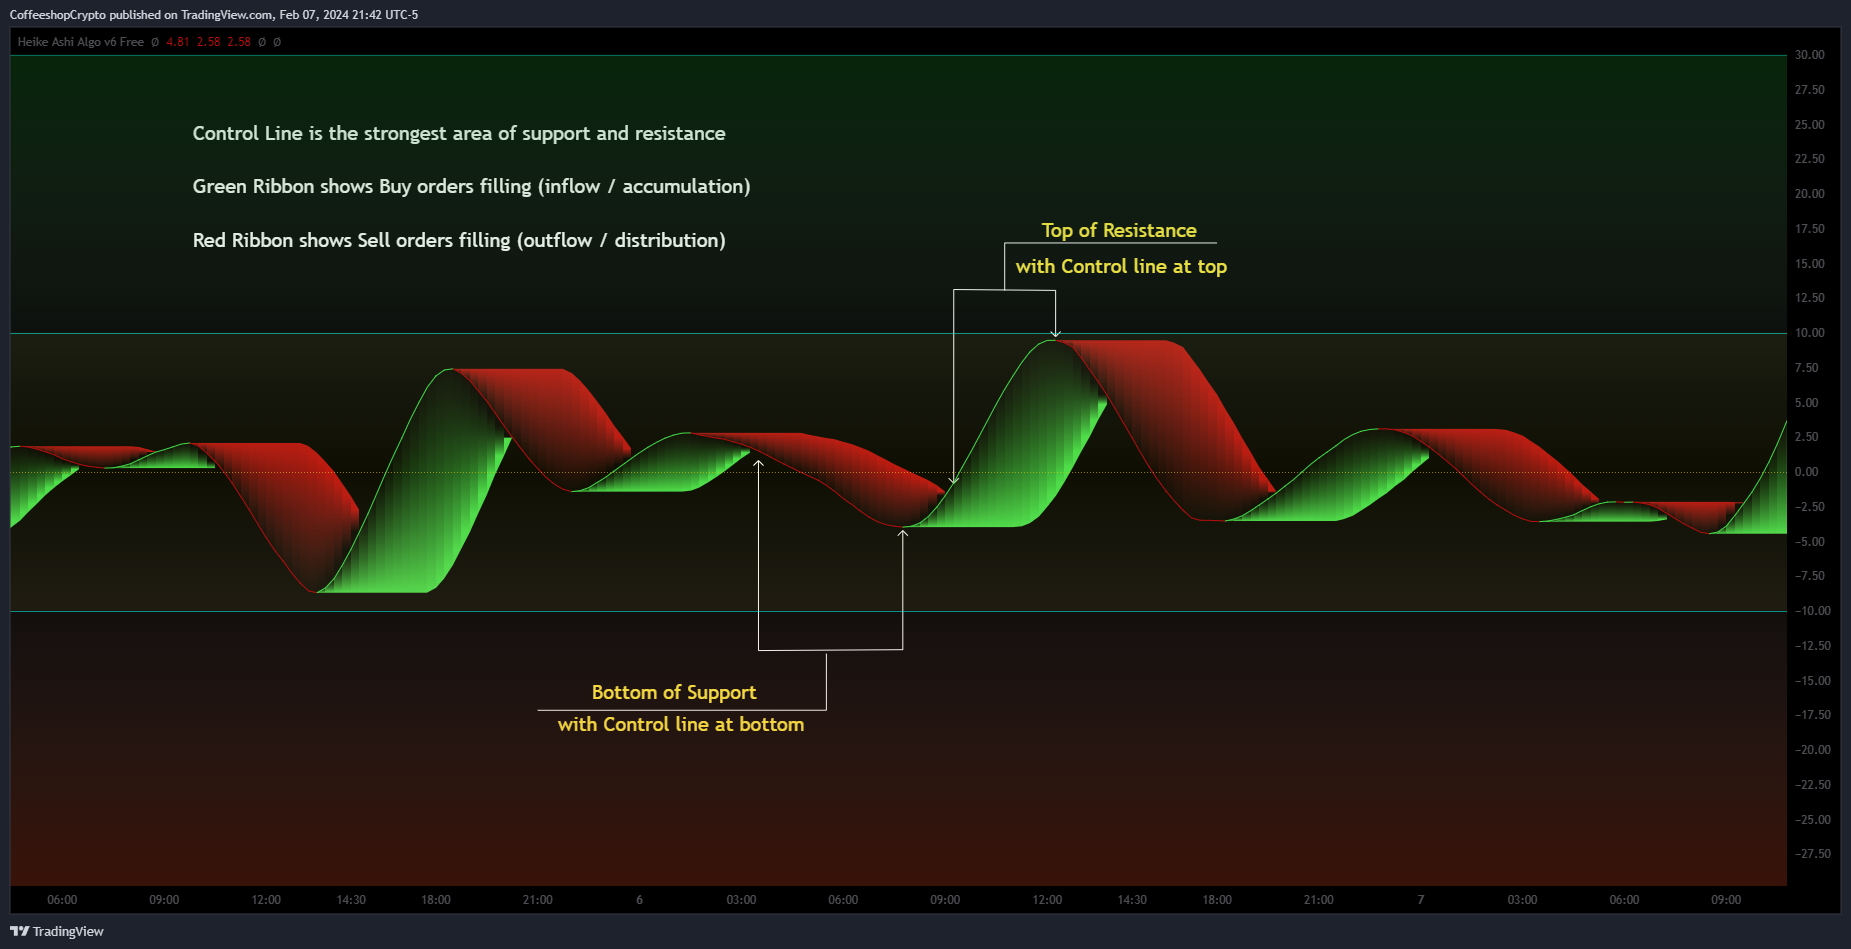
In trading we know liquidity means volume and volume is orders. This ribbon shows you when orders are entering, exiting, filling or flat in the market.
The Liquidity Ribbon is a visual representation of whats happening with accumulation and distribution in the market.
It acts as a dynamic area of support and resistance for the RSI (momentum).
Once the RSI breaks above or below the full area of the ribbon, you have an overturned short term market.
Breaking this area isn't easy because of the one sided thick line known as the PoC line or Point of Control Line.
This line changes between a rising and falling color to tell you what side of the market has the most resistance or support.
The common way for HA candles to be colors is green for bullish and red for bearish.
These candles color differently according to market dynamics vs how the current candle closes.
This is helpful to keep you from taking longs or shorts when the momentum just doesn't have the move.
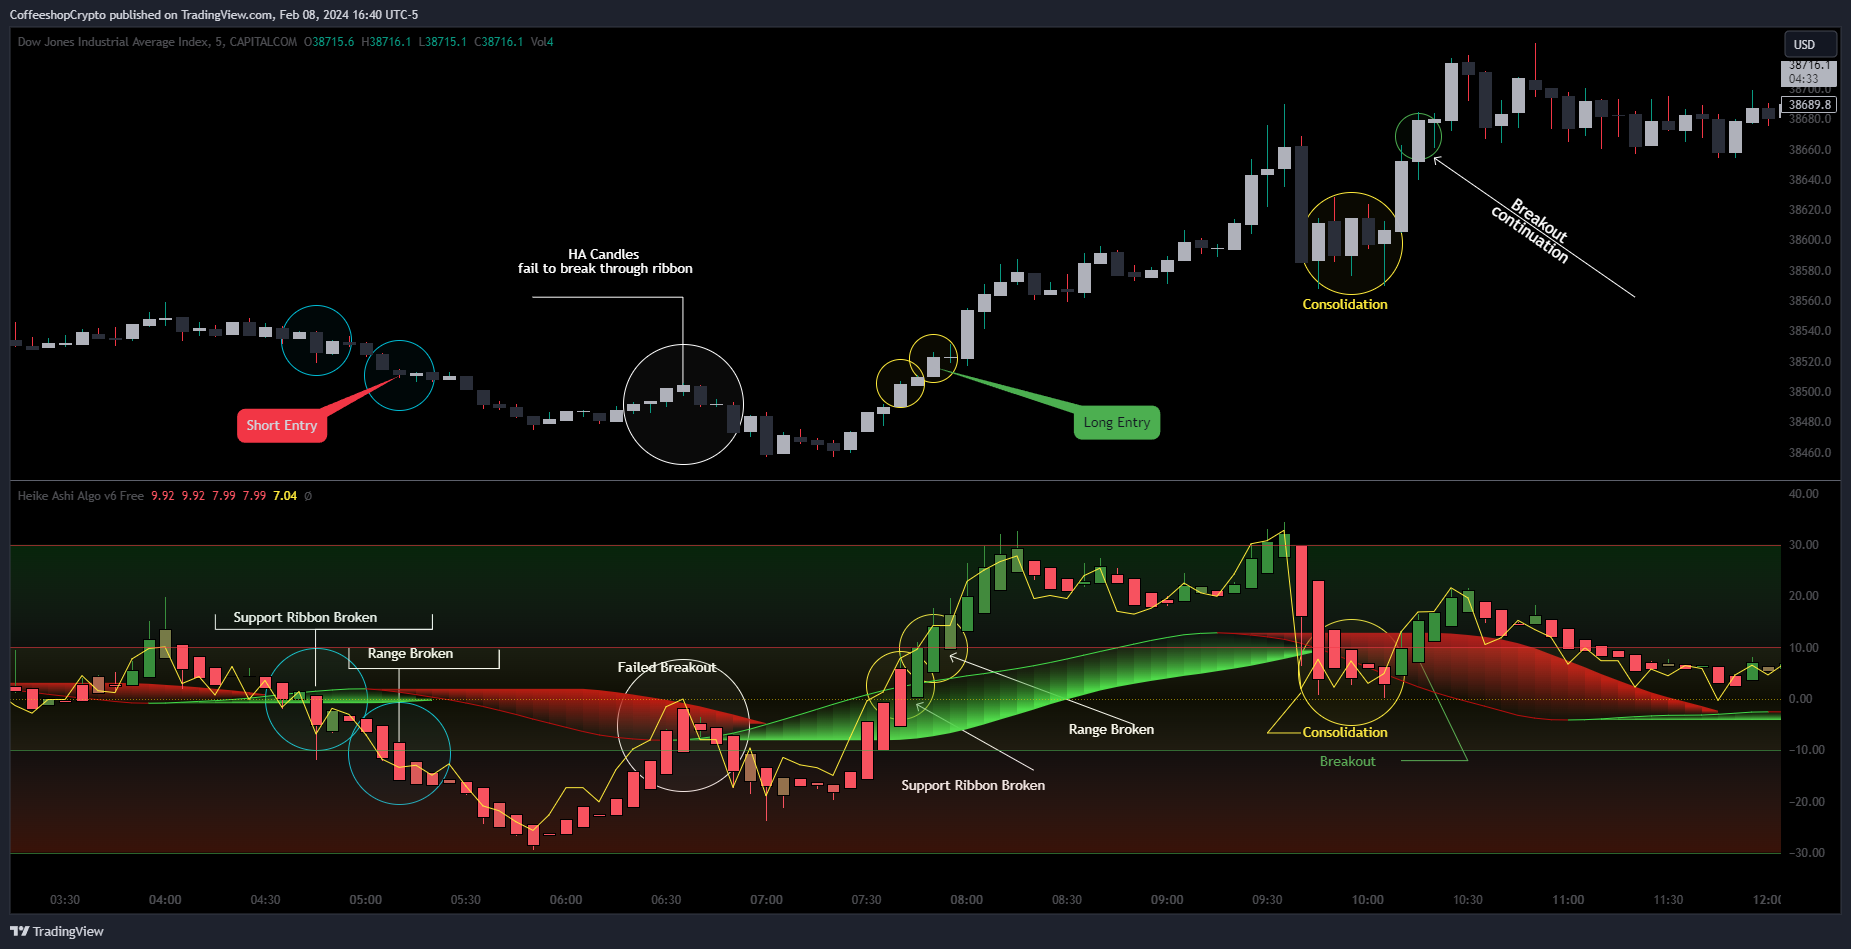
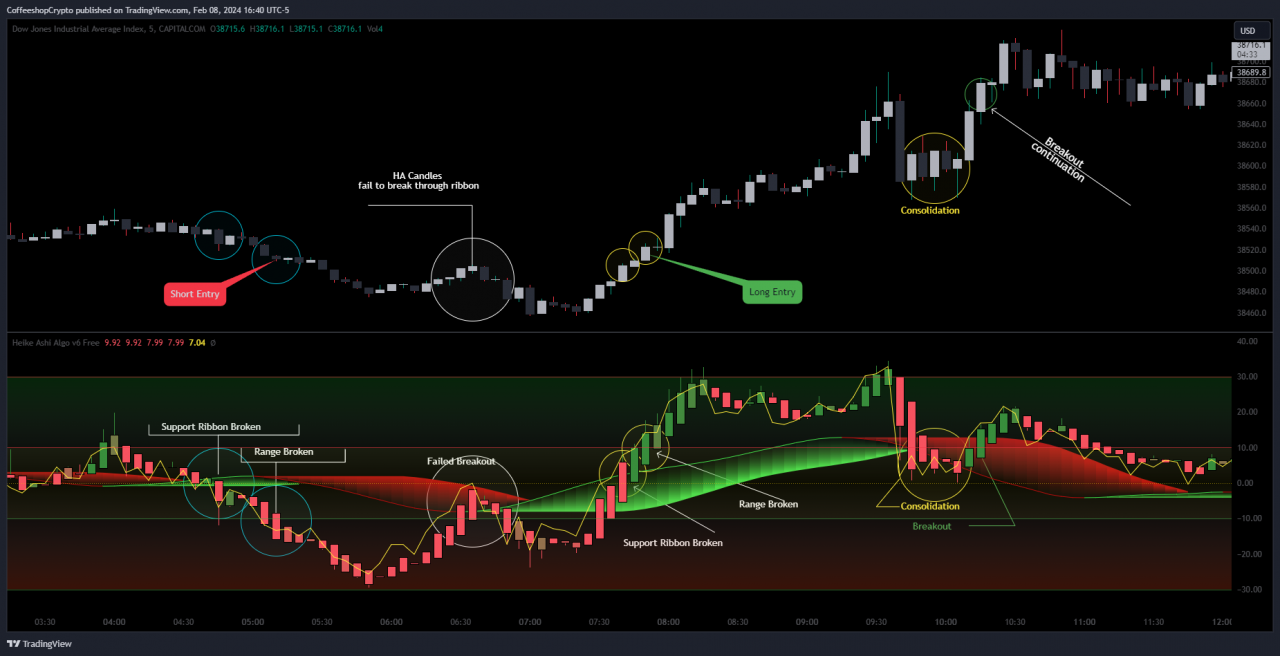
In the image above (left to right) you can see the following take place:
Short Entry:
HA Candles push down through the ribbon breaking below its low side (Support Ribbon Broken)
Following this the RSI RANGE is broken to the down side.
This is a good setup for a short breakout
Retrace to false breakout:
After this price retraces and so does momentum.
HA Candles attempt to but fail to break through the top of the ribbon and push back down . This is a false breakout.
Bullish Divergence to Long Entry:
The Heiken Ashi Algo forms a bullish divergence and HA candles push back up into the ribbon. Without a change in candle structure the RSI breaks the top of the ribbon where the control line sits as well as breaking through the top of the RANGE area and
This is a promising setup for a long trade.
Rally Base Rally: (into secondary long trade)
As price is rising, it retraces until HA candles are within the RANGE. No candle closes or has a low below the RSI midline.
HA Candles are forming a consolidation. After consolidation the RSI breaks out the top of the ribbon and the top of the RANGE allowing a secondary long entry.
I'm not gonna lie. Ive written a lot of tutorials but this one was probably the most exciting to describe.
by CoffeeShopCrypto
If you have any questions please do ask below.
By accepting you will be accessing a service provided by a third-party external to https://www.coffeeshopcrypto.net/
Comments 43
Very nice, great effort, much appreciated. Big fan of CSC HARSI 2022 as well.
Okay. This algo is a keeper Eric so don't wander off with it, please.
Tradingview's replay function should be everyone's secret weapon in learning how price action works with these indicators. I spent about 2 hours with the new algo and doing replays back to all kinds of markets.... bull markets, bear markets, ranging aimless markets, etc. I watched very carefully as each candle moved and what the algo was telling me then went to work live trading with them.
Ended up pulling in around $6k in profits with 4 winning trades, and no losses. Felt a little adventurous last night so traded BTC in 50x cross leverage on the 3-minute chart. Each entry went directly into profit so there was no nail-biting on any of the trades. I have to hand it to the Heiken-ashi secret sauce colored candle setting for that. It kept me from entering too early and having to wait. Once it turned green and broke the 10 of the RSI it was go time.
This is what I wanna do . Congrats
Nice! I have been using this on replay too. Where were you taking profits?
that secret sauce color condition is a KILLER function i created so the candles arent being generated ONLY to the open and close of the candle to make the color. That was too simple.
You know i had to throw my "secret sauce" into it.
Saxyyyyy will read everything today and learn how to use it and give feedback. Thanks eric! @coffeeshopcrypto
Eagerly waiting for your tutorial video too. I love them so much! God bless u bro!
This is what I was also thinking about, combing the indicators!
Thanks. I’m excited about trading with this indicator.
Did you get your copy?
Yes. I see one line is the RSI line. What is the other line on the chart?
That’s ok about responding. I think my question was answered in your recent video. Thanks
This looks great. Time to practice with it
Is there any significance to the colour of the liquidity ribbon and the direction of the HA candles as they pass through it? For example, if the HA candles are rising up through the ribbon while it is green does the move have move momentum than if the ribbon was red at that moment, as buy orders are fuelling the move? And the momentum could be stunted if the colour of the ribbon is opposite to the move? It seems like that in some of my testing, but I might be imagining it
you are not imagining anything. its true. youve almost got it. There is quite a lot of info going on just for the Liq-Ribbon.
Honestly the colors are irrelivant. you can color them whatever you like.
Its important to note that you need a combination of things
LONG example
RSI is above 0
Control line is on top side of ribbon
Control line is rising.
notice how i didnt reflect any color here? Because you can color it whatever you like.
This setup i described basically means ur RSI (the momentum of closing prices) is moving faster than support or resistance can catch up to it. That means really good momentum.
New features are coming to version 6 Premium. THis one will be the BEAST! Better than the Algo from over a year ago
Good..! Now another good thing to work on. Bud stop, creating marvellous things..I have to sleeeeepppp
Thx bud....10x
Did he say so creating ? Lol NEVER
Do I need to change anything in the settings to match my moving averages ?
Thank you for the latest video showcasing the Heiken-Ashi Algo v6 strategy. Under the RSI MA Settings, You have MA Type (which we set to VWMA) and MA Length (which we set at 50) Is it possible to add the feature to increase the thickness size & colour under this RSI Setting's section.
This update will come today